Figures & data
Figure 1. n-HA/PLLA/Fe2O3 composite.
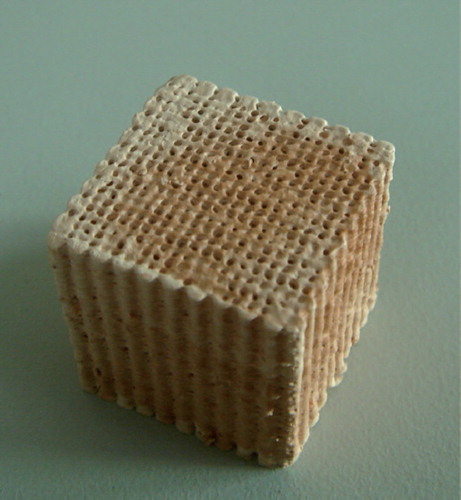
Figure 2. (A) SEM image of n-HA/PLLA/Fe2O3 composite (50×): uniform and interconnected pores, with pore size as large as 500 μm. B) SEM of n-HA/PLLA/Fe2O3 composite (5000×): reticulate structure, rough inner wall of pores, interconnection between the pores, porosity 85%.
Figure 3. Under the microscope, the rat OBs showed oval shape, spindle shape, triangular shape, or the shape of an irregular polygon. (A) P0, (B) P1, (C) P3.
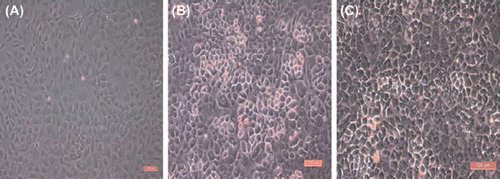
Figure 4. There was no obvious difference in cell proliferation rate on the surface of the scaffold (Group A) and on the plastic culture plate (Group B) (P > 0.05).
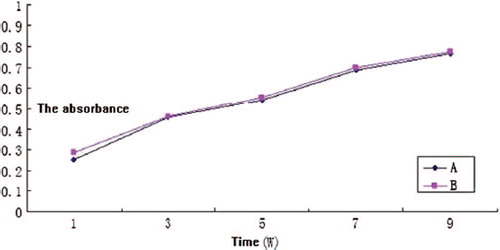
Figure 5. (A), (B), and (C) are SEM images (5000×) of the co-culture of the n-HA/PLLA/Fe2O3 composite and rat OBs at weeks 1, 2 and 3, respectively. With the passage of time, more osteoblasts adhered to the scaffold.
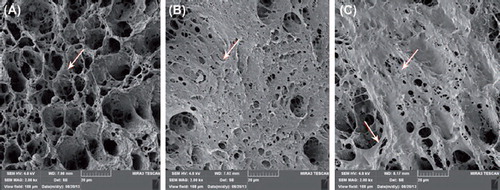
Figure 6. At weeks 1, 2, and 3, the expression of Col-I was increased and the difference was of statistical significance (P < 0.05). The expression of OCN did not show obvious difference (P > 0.05). At week 1, the expression of Col-I was not significantly different from that of P0 (P > 0.05). At weeks 2 and 3, the expression of Col-I was always higher than that of P0 (P < 0.05). At weeks 1, 2, and 3, the expression of OCN was not significantly different from that of P0.