Figures & data
Figure 1. A represents the electrospun collagen nanofibrous sheet stored in PBS. B represents the SEM image of electrospun collagen type I. The matrix illustrates the porous and fibrous nature of the scaffold. Scale bar = 20 μm.
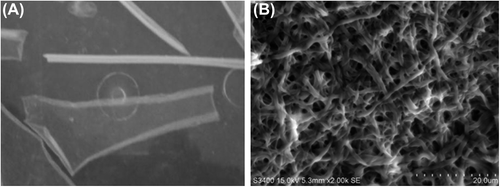
Figure 2. Graphic representation of the distribution of fiber diameters measured from SEM images of four independent scaffolds (n = 4) using ImageJ software. The fiber diameter ranges from 200 nm– 1100 nm.
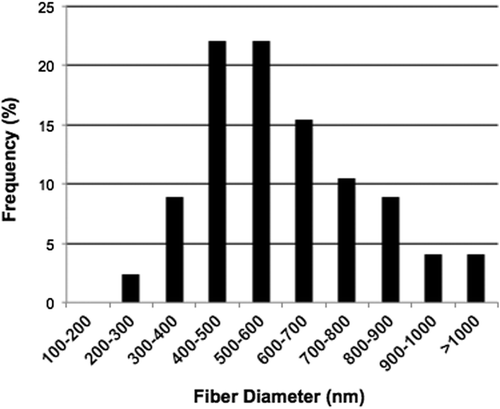
Figure 3. Transmission electron micrographs of electrospun collagen nanofibrous scaffolds exhibit the triple helical repeats of 67 nm D-periodicity banding pattern typical of native collagen (inserted scale bar 250 nm and 50 nm).
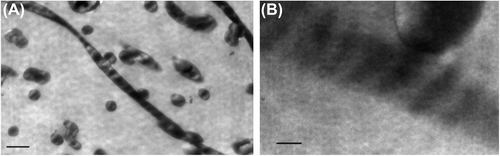
Table I. Represents the porosity measurements of SEM images of four different scaffolds (n = 4) at two different magnifications using ImageJ software. Porosity percentages of three thresholds that help in distinguishing top, middle and lower layers of the nanofiber mats were measured as P1, P2, and P3. Total porosity percentage was the average of the three, and the overall percentage of porosity was estimated by calculating the mean and standard deviation.
Table II. Mechanical properties of the collagen nanofiber scaffold. The tabular column represents the mean and standard deviation of tensile strength, stress, and Young's modulus of 4 different samples of collagen nanofibrous membrane.
Figure 4. Biocompatibility of the collagen scaffold evaluated by MTT assay using L6 rat skeletal myoblasts, cell growth tested at 3 different time points (2, 4 and, 6 days in culture). Myoblasts adhered and proliferated well on collagen nanofiber scaffolds.
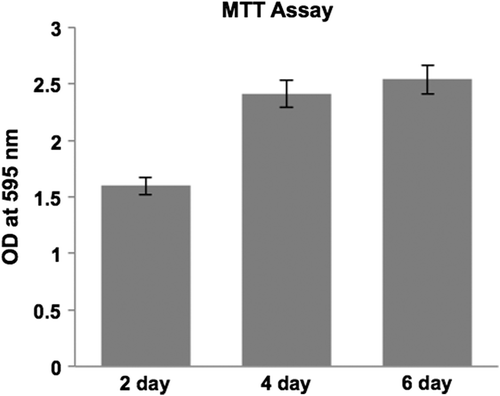
Figure 5. Rat skeletal myoblasts (cell line) were seeded on the collagen nanofibrous scaffold and cultured for 6 days, cryosectioned, and stained. Collagen matrices showed prominent cell adherence and proliferation throughout when examined by immunofluorescence staining using confocal microscopy. A. anti- muscle-specific actin FITC, B. Nuclear staining with propidium iodide, and C. Merged image, D. anti-desmin FITC, E. nuclear staining with propidium iodide, and F. merged image. Scale bar = 50 μm.
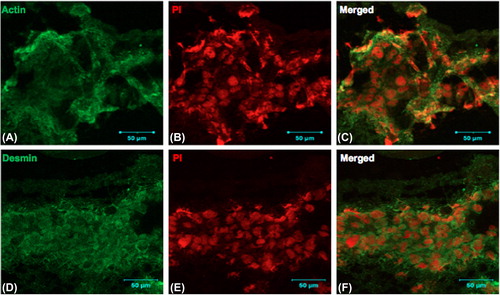
Figure 6. Graphic representation of beating (contracting) of cardiomyocytes on 2D tissue cultureware versus 3D collagen scaffolds, at defined time points.
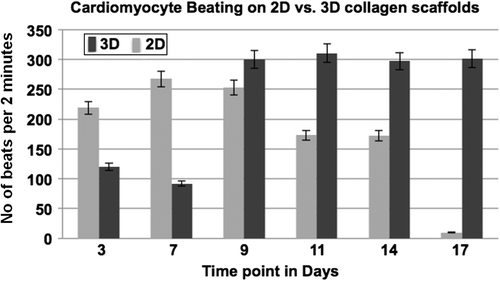
Figure 7. Cryosections of collagen nanofiber scaffolds seeded with (primary cells); neonatal rat cardiomyocytes were stained with the cardiac-specific marker troponin T and examined by immunofluorescence confocal microscopy; A, D, G: anti-troponin-FITC, B, E, H: phase contrast, and C, F, I: merged images. Images A to C (7-day time point), D to F (14-day time point), and G to I (17-day time point) respectively. Scale bar = 50 μm.
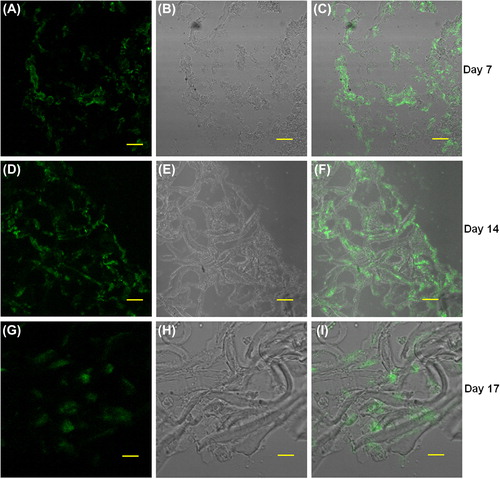
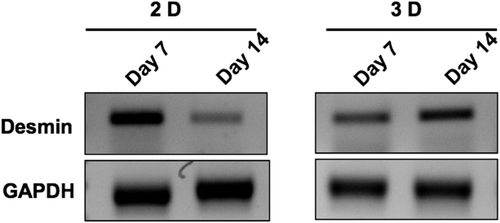
Figure 8. Agarose gel electrophoresis image of RT-PCR analysis of expression of desmin on days 7 and 14 by cardiomyocytes seeded onto 2D cultureware versus 3D collagen nanofiber scaffolds respectively. GAPDH was used as control.