Figures & data
Table I. Sequences of hnRNPB1 probe, blank, and target.
Figure 1. (a) UV–Vis spectrum of prepared GNPs before addition of 5 M NaCl, showing the absorption peak at 524 nm. (b) UV–Vis spectrum of prepared GNPs (insert), after addition of 5 M NaCl, showing absorption peak at 524 nm.
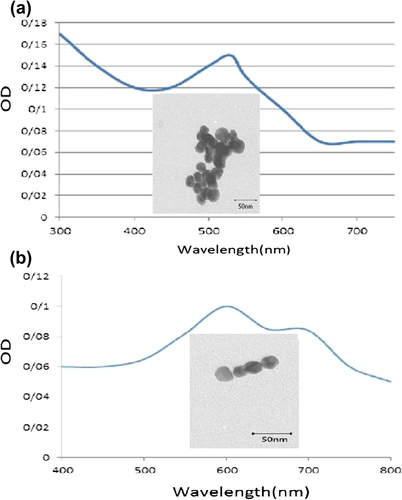
Figure 2. The UV–Vis spectrum of the prepared nanoprobes.
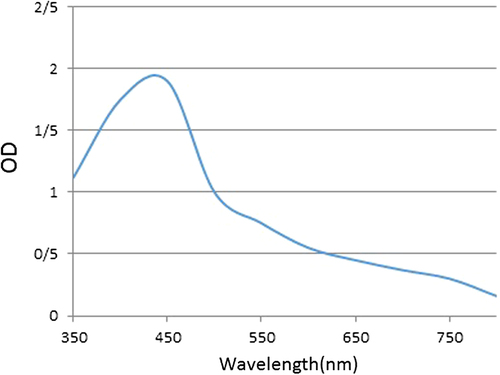
Figure 3. (a) UV–Vis spectra of non-conjugated GNPs, against the aggregation spectra obtained before and after addition of MgCl2, for bare GNPs. (b) UV–Vis spectra of non-conjugated GNPs, against aggregation spectra obtained before and after addition of MgCl2 for bare GNPs. The area under curve (AUC) significantly decreases (*) after addition of MgCl2, in comparison with that before MgCl2 addition, for non-conjugated GNPs (P < 0.05). (c) UV–Vis spectra of conjugated GNPs against aggregation spectra obtained before and after addition of MgCl2, for conjugated GNPs. (d) AUC, UV–Vis spectra of conjugated GNPs, against aggregation spectra obtained before and after addition of MgCl2, for conjugated GNPs. The AUC significantly decreases (*) after addition of MgCl2, in comparison with that before MgCl2 addition, for conjugated GNPs (P < 0.05).
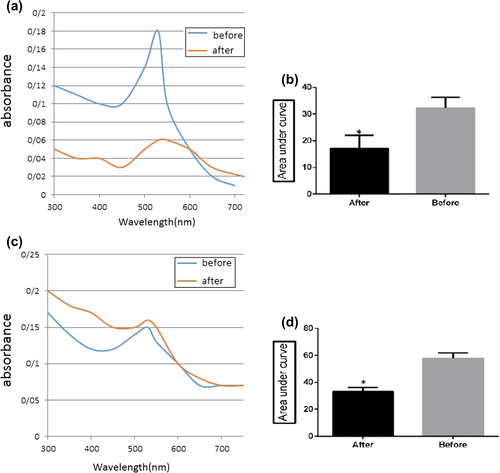
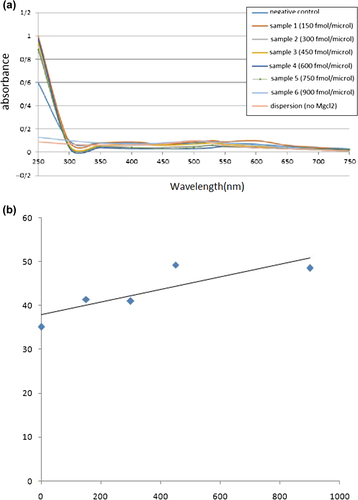
Figure 4. (a) Detection of hnRNPB1 by the nanoprobe designed. UV–Vis spectra change with increase in the target concentration. (b) Detection of AUC of hnRNPB1 by the gold nanoprobe designed, at different concentrations of target.