Figures & data
Figure 1. The assessment of neurological scores and infarct volume. Neurological scores and infarct volumes were appraised at 24 h after cerebral I/R injury. The Garcia score is a functional test used to assess movement, sensory, reflex, and balance deficits. Sprague-Dawley rats (n = 24) were randomized into three groups: control (injury) group, HES group, and pPolyHb treatment groups. A: Comparison of neurological scores at 24 h after I/R injury in different groups. *P < 0.05 compared with the control group. **P < 0.01 compared with the control group. B: TTC staining pictures of brain slices from the three groups. C: Infarct volumes were determined by TTC staining and Adobe Photoshop analysis. At 24 h after reperfusion, isolated brains were sectioned and stained. *P < 0.05 in comparison to the control group.
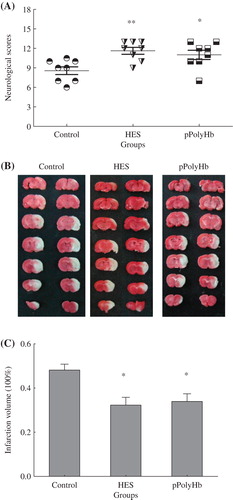
Figure 2. Concentrations of inflammatory cytokines following treatment with different agents. Sprague-Dawley rats (n = 36) were randomized into four groups: sham (normal group), control (injury group), HES and pPolyHb (treatment groups), with 9 rats per group. Plasma from Sprague-Dawley rats was obtained at 6 h, 24 h and 72 h after reperfusion. A: Change of IL-1β level in different groups. Assays were performed in triplicate. *P < 0.05 compared with the sham group at 24 h. B: Change of TNF-α level. Assays were performed in triplicate. *P < 0.05 compared with the sham group at 24 h. #P < 0.05 compared with the control group at 6 h. C: Change of IL-10 level. Assays were performed in triplicate.*P < 0.05 compared with the sham group at 24 h. #P < 0.05 compared with sham group at 6 h.
Figure 3. The levels of MDA and MPO following the MCAO model. Sprague-Dawley rats (n = 36) were randomized into four groups: sham (normal group), control (injury group), and HES and pPolyHb (treatment groups). Brain tissue homogenates were collected at 6 h, 24 h, and 72 h after reperfusion. MDA and MPO levels were detected according to manufacturers’ protocols. Assays were performed in triplicate. A: MDA concentration in different groups. *P < 0.05 compared with the sham group at 24 h. B: MPO activities in different groups. #P < 0.05 compared with the sham group at 6 h.