926
Views
18
CrossRef citations to date
0
Altmetric
Original Article

Development and characterization of floating spheroids of atorvastatin calcium loaded NLC for enhancement of oral bioavailability

, , , &
Pages 1448-1456 | Received 11 Jan 2015, Accepted 13 Apr 2015, Published online: 09 May 2015

Figures & data

Table I. Experimental protocol for in vivo studies.

Table II. Optimization of homogenization time, sonication time, and ratio of solid lipid:liquid lipid.

Table III. Optimization of amount of atorvastatin calcium with respect to lipids ratio.

Figure 1. (A) DSC thermogram of pure atorvastatin calcium. (B) DSC thermogram of final optimized atorvastatin NLCs formulation.
Figure 2. % Drug release of optimized atorvastatin NLCs formulation.

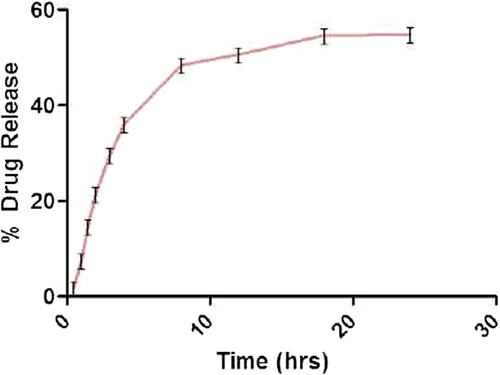
Table IV. Kinetics modeling of atorvastatin calcium NLC13.

Table V. Influence of spheronization speed on the size and shape of floating atorvastatin calcium spheroids.

Table VI. Influence of sizes of extruder die and spheronization plate on the properties of floating atorvastatin calcium spheroids.

Table VII. Optimization of HPMC-K4M with respect to lag floating time and floating time of spheroid.

Table VIII. Optimization of Carbopol 934 with respect to lag floating time and floating time of spheroid.

Table IX. Optimization of concentration of sodium bicarbonate of spheroid.

Table X. Optimization of concentration of citric acid of spheroid.

Table XI. Evaluation parameters for spheroids of atorvastatin calcium.

Figure 3. Motic image of floating spheroid.
Figure 4. Photographic images of stages of spheroid formation during spheronization at (a) 0 s, (b) 15 s, and (c) 30 s.
Figure 5. In vitro release profile of final optimized floating atorvastatin calcium spheroid NLCs.

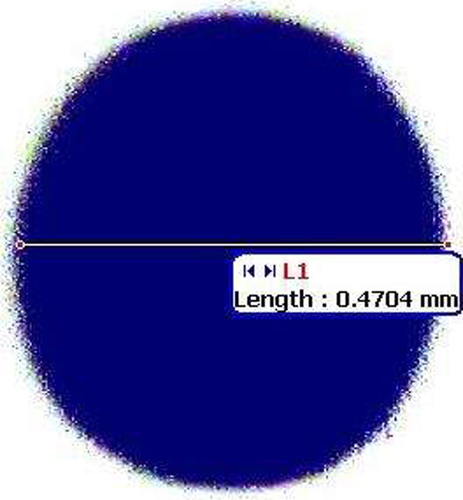
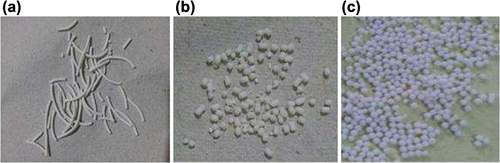
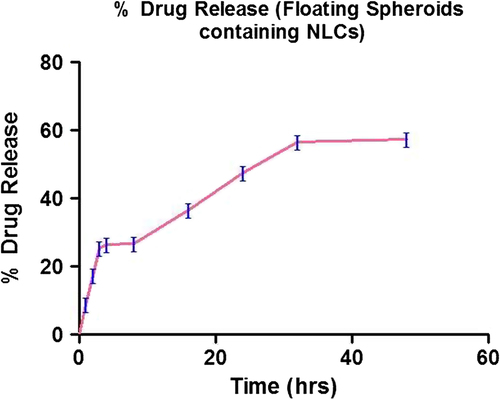
Table XII. In vitro release kinetic of floating atorvastatin calcium spheroids-loaded NLCs.

Figure 6. Plasma concentration–time curve following oral administration of atorvastatin calcium MF, atorvastatin calcium-loaded NLC formulations (NLC), and floating atorvastatin calcium spheroids-loaded NLC (NLC-S) groups of Wistar rats.

Table XIII. Pharmacokinetic parameters of control and test sample calculated using plasma concentration–time data using software Kinetica.

Reprints and Corporate Permissions

Please note: Selecting permissions does not provide access to the full text of the article, please see our help page How do I view content?

To request a reprint or corporate permissions for this article, please click on the relevant link below:

Academic Permissions

Please note: Selecting permissions does not provide access to the full text of the article, please see our help page How do I view content?

Obtain permissions instantly via Rightslink by clicking on the button below:

If you are unable to obtain permissions via Rightslink, please complete and submit this Permissions form. For more information, please visit our Permissions help page.