1,463
Views
28
CrossRef citations to date
0
Altmetric
Original Article

Application of Box–Behnken design to prepare gentamicin-loaded calcium carbonate nanoparticles

, , , &
Pages 1475-1481 | Received 01 Mar 2015, Accepted 14 Apr 2015, Published online: 07 May 2015

Figures & data

Table I. Factor-setting for the experimental design.

Table II. Particle size (PS) and percent entrapment efficiency (EE %) values for fifteen formulations.

Figure 1. Counter plot and response surface plot for the effects of the homogenization speed and drug concentration on particle size.
Figure 2. Counter plot and response surface plot for the effects of the homogenization speed and the molar ratio of CaCl2:Na2CO3 on particle size.
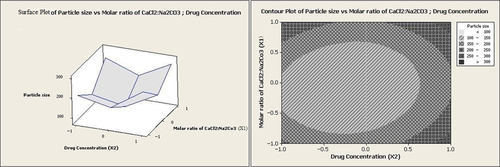
Figure 3. Counter plot and response surface plot for the effects of the drug concentration and the molar ratio of CaCl2:Na2CO3 on particle size.
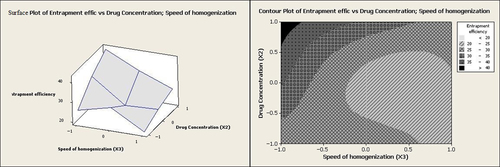
Figure 4. Counter plot and response surface plot for the effects of the drug concentration and the homogenization speed on entrapment efficiency.
Figure 5. Counter plot and response surface plot for the effects of the drug concentration and the molar ratio of CaCl2:Na2CO3 on entrapment efficiency.
Figure 6. Counter plot and response surface plot for the effects of the homogenization speed and the molar ratio of CaCl2:Na2CO3 on entrapment efficiency.
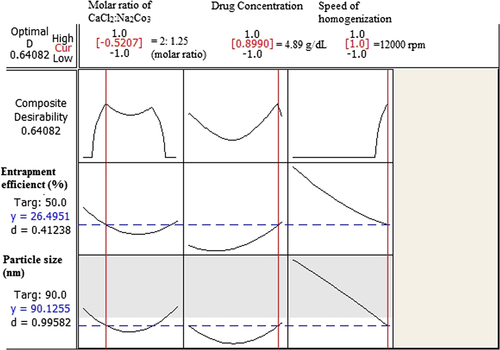
Figure 7. Optimization plot for the preparation of gentamicin sulfate–CaCO3 nanoparticles. The optimum points (PS = 90.12 nm, EE% = 26.49%) were defined as − 0.52, 0.89, and 1, which gives the values of 2:1.25, 4.89 g/dl, and 12,000 rpm for the molar ratio of CaCl2:Na2CO3, concentration of drug, and the homogenization speed respectively.

Table III. Percent error (PE) and mean percent error (MPE) between calculated and observed values for each response.

Figure 8. Particle size distribution for the optimized formulation actually prepared.

Reprints and Corporate Permissions

Please note: Selecting permissions does not provide access to the full text of the article, please see our help page How do I view content?

To request a reprint or corporate permissions for this article, please click on the relevant link below:

Academic Permissions

Please note: Selecting permissions does not provide access to the full text of the article, please see our help page How do I view content?

Obtain permissions instantly via Rightslink by clicking on the button below:

If you are unable to obtain permissions via Rightslink, please complete and submit this Permissions form. For more information, please visit our Permissions help page.