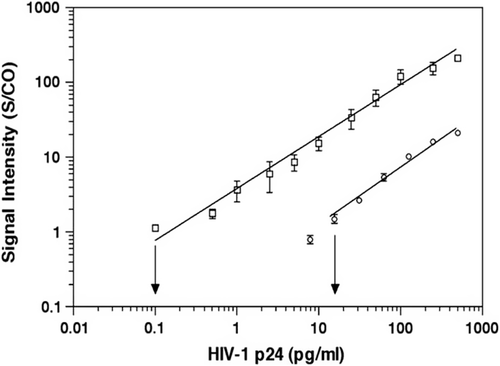
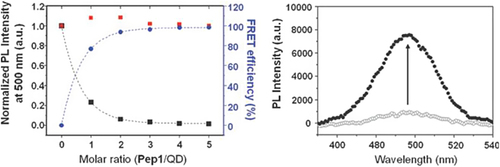
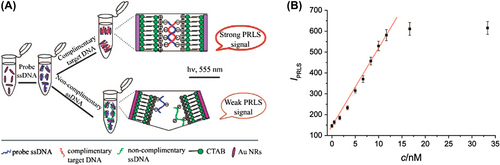
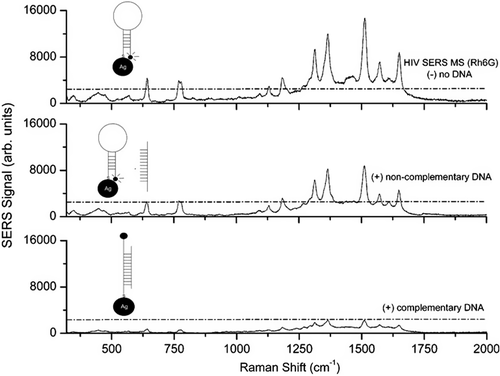
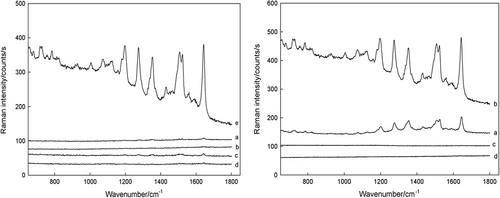
1,298
Views
3
CrossRef citations to date
0
Altmetric
Review

Nanomaterials and Optical Diagnosis of HIV

Pages 1383-1390 | Received 15 Mar 2015, Accepted 14 May 2015, Published online: 23 Jun 2015

Figures & data

Figure 1. Increased sensitivity of BCA assay compared to in-house ELISA in detecting HIV-1 p24 antigen. HIV-1 p24-positive control antigen, ranging from 0.1 to 500 pg/mL in serial dilution in PBS, served as targets. BCA assay is represented by an open square, ELISA by an open circle. The error bar represents the standard deviation of at least 3 independent, repeated experiments for each assay. The correlation between the HIV-1 p24 BCA assay and the concentrations of HIV-1 p24 were r = 0.9357 (R 2 = 0.8756; P, 0.0001) (by permission from the authors) (CitationTang et al. 2007).
Figure 2. The particle detection of HIV gp120 by applying antibody-conjugated beads (CitationKim et al. 2009).
Figure 3. Colorimetric assays of RNase H enzyme at different concentrations (a) Colorimetric responses of the reaction mixtures on addition of different amounts of RNase H enzyme. (b) The corresponding absorption ratio of the resulting solution at 520 and 650 nm as a function of the enzyme concentration (by permission from authors) (CitationXie et al. 2011).
Figure 4. Schematic representation of HIV-1 protease assay based on FRET-quenched QD–peptide complex. After the DPA (DHLA–PEG–Amine) ligand exchange of QD–TOPO, the QD becomes water-soluble. 6E-peptide-dabcyl indicates 6E-GLAib-SQNYPIVQ-K(dabcyl), or 6Glu-Gly-Leu-Aib-2Gly-Ser-Gln-Asp-Tyr-Pro-Ile-Val-Lys(dabcyl); Aib = amino-isobutyric acid (CitationChoi et al. 2010).
Figure 5. (Left) Normalized QD PL intensity at 500 nm in arbitrary units (a.u.) depending on the molar ratio of Pep1 to QD 1 (black square) and the corresponding FRET efficiency (blue circle); the red square indicating QD PL in the presence of an equivalent amount of free dabcyl dye. (Right) Increase of QD PL after HIV-1 PR digestion of the QD–Pep1 complex 2 in the acetate buffer (pH 4.5) (CitationChoi et al. 2010).
Figure 6. (A) Schematic representation of the DNA hybridization detection with the AuNR genosensing system. (B) Linear graph of the PRLS signals on the concentration of target DNA: probe DNA, 16.67 nM; λ, 555 nm; Tris-HCl buffer solution (8.3 mM; pH 7.4); NaCl, 0.2 M (by permission from American Chemical Society) (CitationHe et al. 2008).
Figure 7. The SERS spectra from the HIV-1 SERS MS nanoprobe targeted to the HIV-1 gene: (upper curve) the absence of the target DNA; (middle curve) the presence of a noncomplementary target sequence, SERS MS nanoprobes were not disrupted; (lower curve) the HIV-1 SERS MS nanoprobes bind to the target DNA (positive recognition), thus resulting in the physical separation of the rhodamine 6G label from the surface of the AgNPs, and as a result, the SERS signal from the MS nanoprobes become significantly quenched (by permission from American Chemical Society, CitationWabuyele and Vo-Dinh 2005).
Figure 8. Left: Raman signal of the hybridization assay conducted in the presence of: (a) non-complementary oligonucleotides; (b) four-base mismatch oligonucleotides; (c) two-base mismatch oligonucleotides; (d) single-base mismatch oligonucleotides; (e) complementary oligonucleotides. Right: SERS spectroscopy of different NPs: (a) Ag/SiO2 NP-based Raman tags modified with oligonucleotides; (b) hybridization product containing Raman tags and magnetic NPs; (c) magnetic NPs modified with capture oligonucleotides; (d) the hybridization product of target oligonucleotides and magnetic NPs modified with capture oligonucleotides (by permission from the authors, CitationLiang et al. 2007).
Figure 9. Top: SERS spectra of the partial sequence of the HIV-1 gag gene, in the presence of the popcorn-shaped nanoparticle and hybrid graphene oxide. Bottom: Plot showing SERS enhancement of the Raman signal at 785 nm excitation from Rh6G, in the presence of graphene oxide, gold nanopopcorn, and a nanopopcorn-attached graphene oxide hybrid (by permission from American Chemical Society, CitationFan et al. 2013).
Figure 10. Normalized Raman intensities of the 1497 cm− 1 peak for different target molecules at 10 − 16 M with one-, two-, and four-base mismatched oligonucleotides (a, b, c, d). The result obtained from the 10 − 19 M HIV system is shown as the reference (by permission from the Royal Society of Chemistry, CitationHu et al. 2010).

Reprints and Corporate Permissions

Please note: Selecting permissions does not provide access to the full text of the article, please see our help page How do I view content?

To request a reprint or corporate permissions for this article, please click on the relevant link below:

Academic Permissions

Please note: Selecting permissions does not provide access to the full text of the article, please see our help page How do I view content?

Obtain permissions instantly via Rightslink by clicking on the button below:

If you are unable to obtain permissions via Rightslink, please complete and submit this Permissions form. For more information, please visit our Permissions help page.