Figures & data
Table I. Factorial design showing the design matrix and effect of independent variables on mean particle size.
Table II. Box–Behnken design showing the effect of selected variables on mean particle size and percentage drug encapsulation.
Figure 1. Main effect of the variables on mean particle size studied using factorial design.
Figure 2. Contour plot. The effect of various levels of CPR and homogenization speed on mean particle size when the level of remaining variables are maintained either at (a) low level or (b) high level.
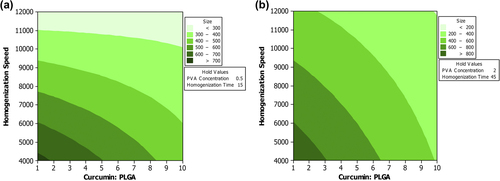
Figure 3. Overlaid contour plot showing the level of CPR and PVA concentration required to achieve mean particle size less than 400 nm when the homogenization speed and homogenization time were maintained at 12000 rpm and 45 min respectively.
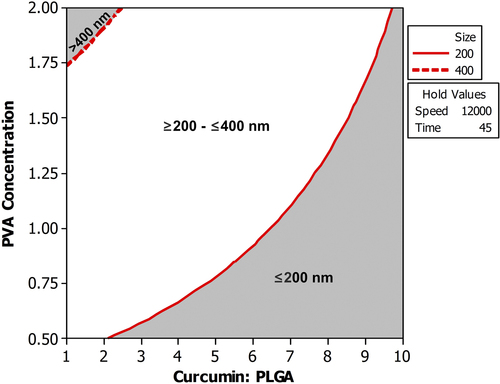
Figure 4. Main effect plot (a) Linear effect of the variables on mean particle size (b) Linear effect of the variables on PDE.
Figure 5. Interaction effect plot (a) Effect of interaction of the variables on mean particle size (b) Effect of interaction of the variables on PDE.
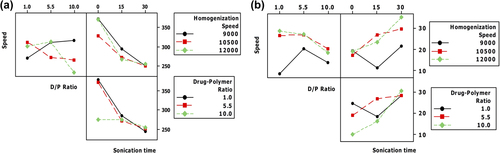
Figure 6. Overlaid contour plot showing the effect of various levels of homogenization speed and CPR on mean particle size and percentage drug encapsulation when the sonication time was maintained at 30 s.
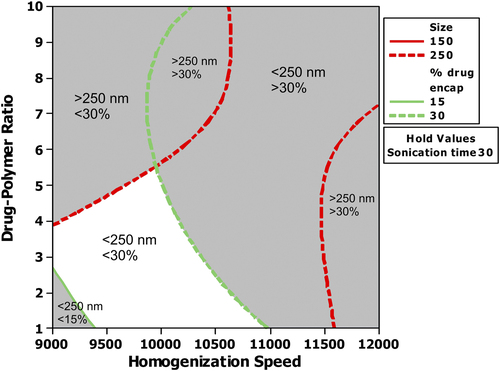
Figure 7. Percentage of curcumin released from CPNs at various time intervals.
Figure 8. Change in body weight and tumor volume in various animal groups (a) Percentage increase in body weight of EAC-bearing animals receiving treatment (b) Tumor volume in EAC-bearing mice receiving treatment. ‘*’ shows that the difference in the tumor volume between the EAC control and the treatment group was significant.
Figure 9. Effect of treatment on survival rate of animals.
Table III. Mean life span and percentage increase in mean life span in EAC-bearing mice receiving treatment.
Figure 10. Effect of treatment on hematological parameters. ‘a’ shows that there was a significant increase in WBC level and decrease in Hb level in the EAC control compared to the normal. ‘b’ shows that the change in WBC level and Hb level is not significant when compared to the normal control. ‘c’ shows that treatment significantly reversed EAC-induced increase in WBC level and EAC-induced decrease in Hb level when compared to EAC control.
Figure 11. Histopathology of various organs (10X) (a) Histopathology of liver (b) Histopathology of spleen (c) Histopathology of kidney.
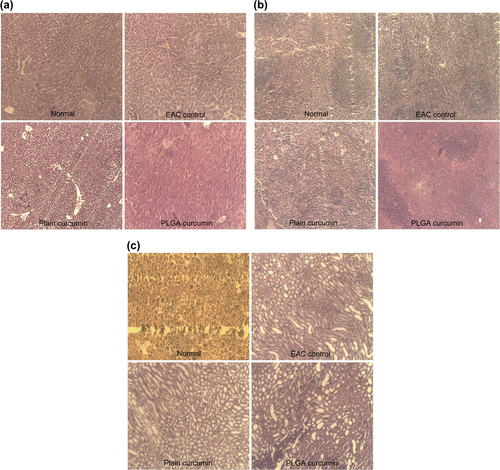
Figure 12. Percentage of curcumin released from PCL-based CPNs.