Figures & data
Figure 1. Concentrations of inflammatory mediators in neutrophils treated with different agents. Neutrophils were treated in vitro with different concentrations of BSA (negative control), Staphylococcus aureus or E. coli (positive controls), or pPolyHb, for 12 h. In and , IL-1β and IL-10 levels were detected using Rat IL-1β and Rat IL-10 Elisa Kits (DAKEWE) according to manufacturer's protocol. In , the percentage of CD11b/CD18-positive cells was determined by flow cytometric analysis of cells incubated with PE mouse anti-rat CD11b and FITC mouse anti-rat CD18 antibodies. Assays were performed in triplicate. (A) Comparison of IL-1β levels in neutrophils treated with different agents. **p < 0.01 compared with the E.coli group, ##p < 0.01 compared with the S.aureus group. (B) Comparison of IL-10 levels in neutrophils treated with different agents. *p < 0.05 compared with the E.coli group, ##p < 0.01 compared with the S.aureus group. (C) Percent of cells expressing CD11b/CD18 following treatment with different agents. **p < 0.01 compared with the E.coli group.
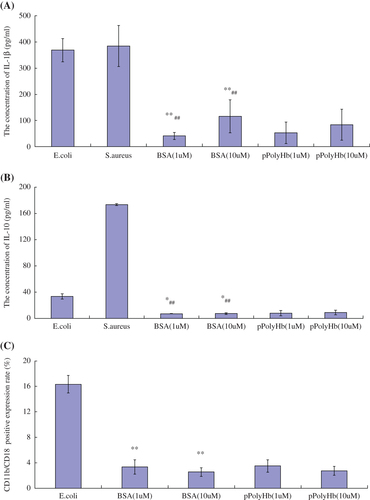
Figure 2. Concentrations of inflammatory mediators in macrophages treated with different agents. Macrophages were treated with different concentrations of BSA (negative control), Staphylococcus aureus or E. coli (positive controls), or pPolyHb, for 12 h. Assays were performed as described in , in triplicate. (A) Comparison of IL-1β levels in macrophages treated with different agents. **p < 0.01 compared with the E.coli group, ##p < 0.01 compared with the S.aureus group. (B) Comparison of IL-10 levels in macrophages treated with different agents. *p < 0.05 compared with the E.coli group, ##p < 0.01 compared with the S.aureus group.
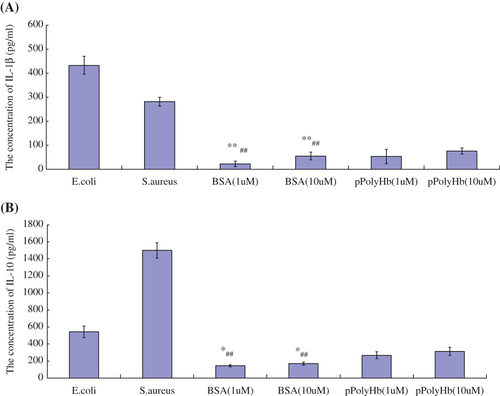
Figure 3. Changes in the levels of inflammatory mediators in healthy rats injected with different agents. Sprague Dawley rats (n = 21) were randomized into seven groups: E.coli (2 × 10¹² units; positive control), pPolyHb (2 g/kg), pPolyHb (4 g/kg), saline (equal volume to pPolyHb), and Hetastarch (HES, equal volume to pPolyHb) (negative control). Serum or blood was collected before the treatment (baseline) and at 12 h and 24 h after intravenous administration. IL-1β and IL-10 levels ( and ), and the percent of cells positive for CD11b/CD18 (), were determined as described in the methods. Assays were performed in triplicate. (A) Levels of IL-1β in healthy rats treated with various agents. **p < 0.01 compared with the E.coli group at 12 h. (B) Levels of IL-10 in healthy rats treated with various agents. **p < 0.01 compared with the E.coli group at 12 h. (C) Percent of CD11b/CD18-positive cells in healthy rats treated with different agents. **p < 0.01 compared with the group of E.coli at 12 h, *p < 0.05 compared with the E.coli group at 24 h.
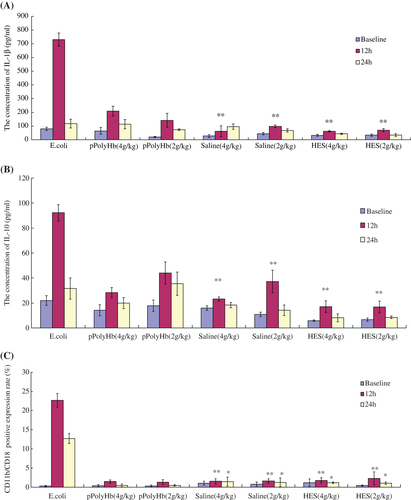
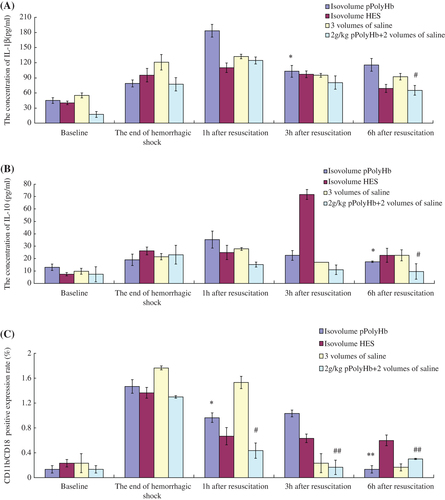
Figure 4. Changes in the levels of inflammatory mediators in rat HS model. Sprague Dawley rats (n = 12) underwent volume-controlled hemorrhage. They were resuscitated 90 min later, with pPolyHb or HES (volume equal to that of lost blood), saline (volume triple that of the lost blood), or 2 g/kg pPolyHb plus two volumes of saline. Blood samples were withdrawn before HS (baseline), at the end of shock, and at 1 h, 3 h, and 6 h after resuscitation. IL-1β, IL-10 levels ( and ) and the percent of cells positive for CD11b/CD18 () were detected as in . Assays were performed in triplicate. (A) Levels of IL-1β in rat HS model resuscitated with different fluids. *p < 0.05 compared with the isovolume pPolyHb group at 1 h after resuscitation, #p < 0.05 compared with the group of 2 g/kg pPolyHb + 2 volumes of saline at 1 h after resuscitation. (B) Levels of IL-10 in HS rats resuscitated with different fluids. *p < 0.05 compared with the isovolume pPolyHb group at 1 h after resuscitation, #p < 0.05 compared with the group of 2 g/kg pPolyHb + 2 volumes of saline at 1 h after resuscitation. (C) Percent of CD11b/CD18-positive cells in HS rats resuscitated with different fluids. *p < 0.05, **p < 0.01 compared with the isovolume pPolyHb group at the end of HS; #p < 0.05, ##p < 0.01compared with the group of 2 g/kg pPolyHb + 2 volumes of saline at the end of HS.