851
Views
13
CrossRef citations to date
0
Altmetric
ORIGINAL ARTICLE

Polyelectrolyte complexes of hTERT siRNA and polyethyleneimine: Effect of degree of PEG grafting on biological and cellular activity

, , , &
Pages 1561-1568 | Received 29 Apr 2015, Accepted 18 Jun 2015, Published online: 31 Jul 2015

Figures & data

Figure 1. (a) 1H-NMR spectrum of PEG-g-PEI at a molar ratio of 0.2:1. (b) 1H-NMR spectrum of PEG-g-PEI at a molar ratio of 1:1.
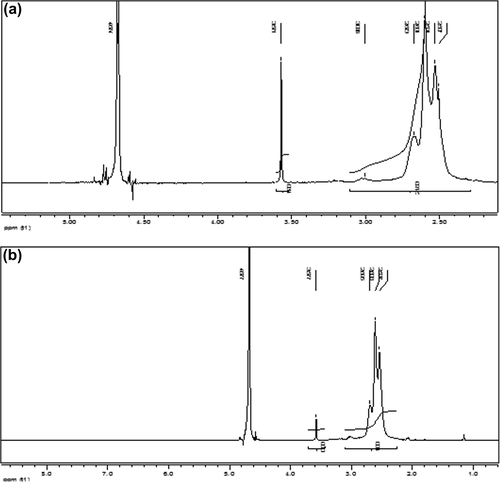
Figure 1. (a) 1H-NMR spectrum of PEG-g-PEI at a molar ratio of 0.2:1. (b) 1H-NMR spectrum of PEG-g-PEI at a molar ratio of 1:1.

Table I. Particle size and zeta potential of polyplexes, determined by DLS. Values represented as mean ± S.D.

Figure 2. Ethidium bromide dye exclusion assay shows effect of N/P ratios on complex condensation at different degrees of PEG grafting.
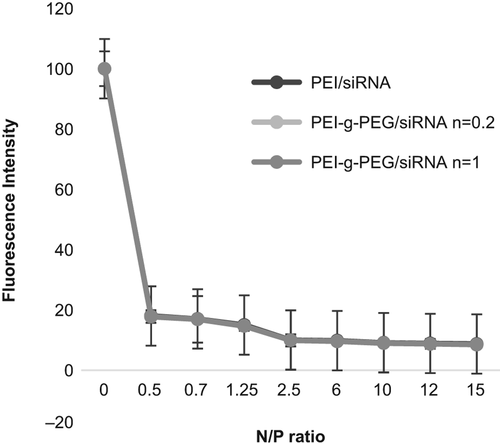
Figure 2. Ethidium bromide dye exclusion assay shows effect of N/P ratios on complex condensation at different degrees of PEG grafting.

Figure 3. Polyanion competition assay evaluated the effect of N/P ratios on stability of PECs of siRNA at different degrees of PEG grafting.
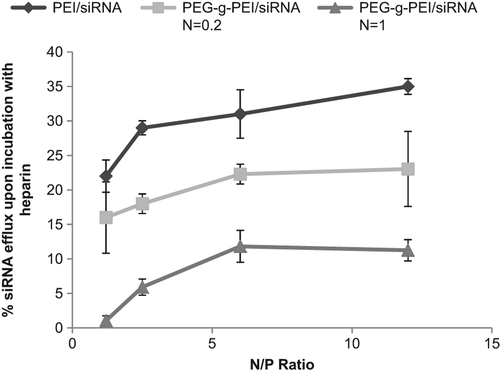
Figure 3. Polyanion competition assay evaluated the effect of N/P ratios on stability of PECs of siRNA at different degrees of PEG grafting.

Figure 4. Transfection efficiency of polyplexes. Flow cytometry shows transfection of A549 cell line after 4 h of treatment with polyplexes at different N/P ratios and PEGylation degrees.
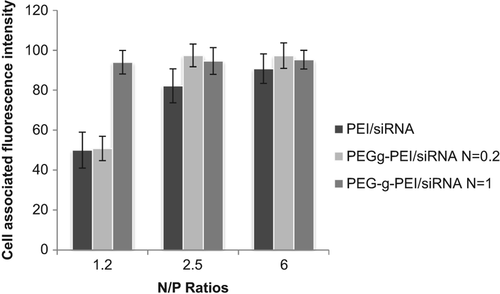
Figure 4. Transfection efficiency of polyplexes. Flow cytometry shows transfection of A549 cell line after 4 h of treatment with polyplexes at different N/P ratios and PEGylation degrees.

Figure 5. (a) Cytotoxicity of polyelectrolyte complexes alone at different degrees of PEG grafting and various concentrations on A549 cell line after 4 h of incubation. (b) Cytotoxicity of polyelectrolyte complexes alone at different degrees of PEG grafting and various concentrations on the A549 cell line after 24 h of incubation.
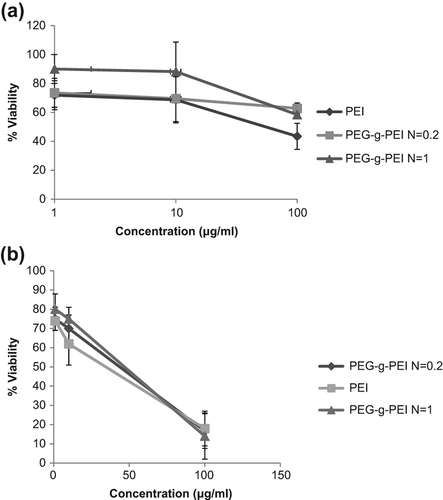
Figure 5. (a) Cytotoxicity of polyelectrolyte complexes alone at different degrees of PEG grafting and various concentrations on A549 cell line after 4 h of incubation. (b) Cytotoxicity of polyelectrolyte complexes alone at different degrees of PEG grafting and various concentrations on the A549 cell line after 24 h of incubation.
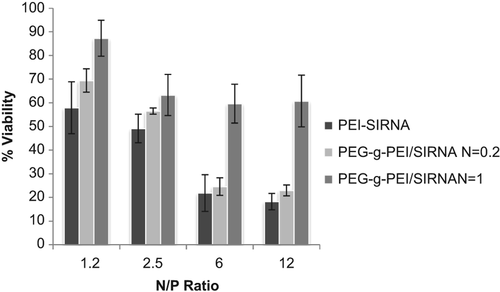
Figure 6. Viability assay results from the A549 cell line encountered with PECs of siRNA for 4 h. and incubated for 48 h, at different degrees of PEG grafting and N/P ratios.

Figure 6. Viability assay results from the A549 cell line encountered with PECs of siRNA for 4 h. and incubated for 48 h, at different degrees of PEG grafting and N/P ratios.

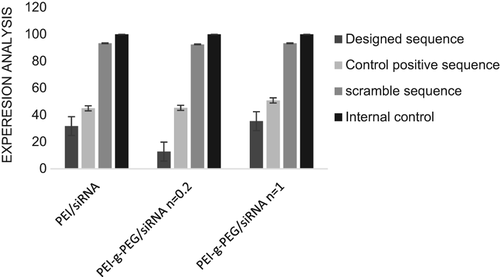
Figure 7. Gene-silencing efficiency of hTERT nanoscale complexes at different degrees of PEG grafting and N/P ratio of 2.5 in the A549 cell line after 4 h of treatment and 48 h of incubation.

Figure 7. Gene-silencing efficiency of hTERT nanoscale complexes at different degrees of PEG grafting and N/P ratio of 2.5 in the A549 cell line after 4 h of treatment and 48 h of incubation.

Reprints and Corporate Permissions

Please note: Selecting permissions does not provide access to the full text of the article, please see our help page How do I view content?

To request a reprint or corporate permissions for this article, please click on the relevant link below:

Academic Permissions

Please note: Selecting permissions does not provide access to the full text of the article, please see our help page How do I view content?

Obtain permissions instantly via Rightslink by clicking on the button below:

If you are unable to obtain permissions via Rightslink, please complete and submit this Permissions form. For more information, please visit our Permissions help page.