Figures & data
Table I. Drug content, production yield, and encapsulation efficiency.
Figure 1. Optical microscopy of PB-SA (A) and PB-SA-CA (C) microcapsules. L1 corresponds to the vertical diameter and L2 to the horizontal diameter. SEM micrographs of PB-SA (B) and PB-SA-CA (D) microcapsules are also shown. Panels in B: (1) 200 μm scale, (2) surface morphology at 2 μm scale, and (3 and 4) 10 μm scale. Panels in D: (1) 200 μm scale, (2) surface morphology at 20 μm scale, and (3 and 4) 1 μm scale.
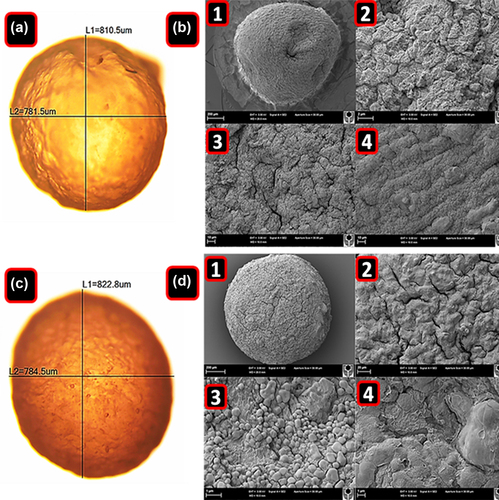
Figure 2. Energy-dispersive X-ray spectra of PB-SA microcapsule surface showing drug deposition (a–1) and surface composition (c–2) with corresponding analyses (b and d), and energy-dispersive X-ray spectra of PB-CA-SA microcapsule surface showing drug deposition (e–1) and surface composition (g–2) with corresponding analyses (f and h).
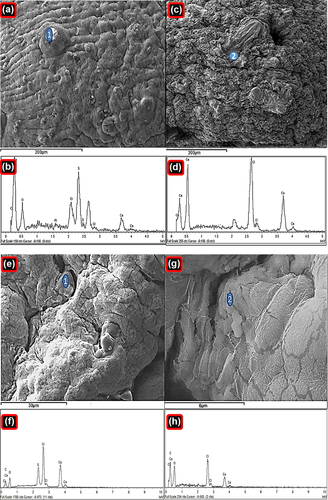
Figure 3. Distribution of TRITC–CA within PB-CA-SA microcapsules (a–c).
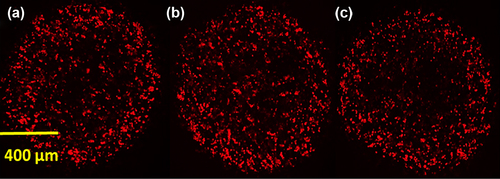
Figure 4. Swelling characteristics of PB-SA and PB-CA-SA microcapsules (pH 3 and 7.8) at 25°C (a), swelling characteristics of PB-SA and PB-CA-SA microcapsules (pH 3 and 7.8) at 37°C (b), mechanical strength testing of PB-SA (control) and PB-CA-SA (test) microcapsules (c), buoyancy of PB-SA (control) and PB-CA-SA (test) microcapsules (d), probucol release over time from PB-SA and PB-CA-SA microcapsules at pH 3 and 1.5 (e), and probucol release over time from PB-SA and PB-CA-SA microcapsules at pH 7.8 and 6 (f).
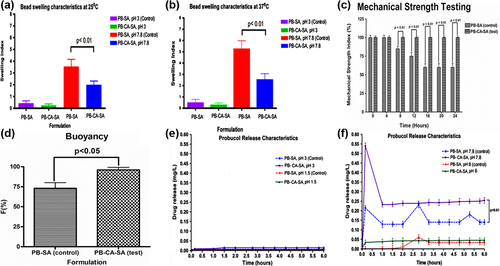
Figure 5. Micro-CT images of PB-SA microcapsules (a–d) and PB-CA-SA microcapsules (e–h). The visible purple color in PB-CA-SA (e–h) reflects a greater density of the core of microcapsules caused by incorporation of CA into the matrix.
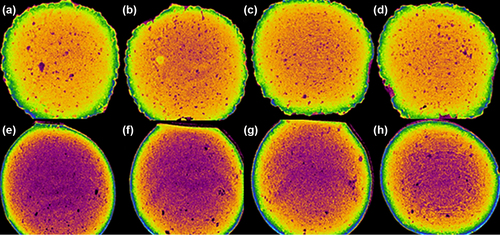
Figure 6. DSC thermograms of (a) PB powder, (b) CA powder, (c) SA powder, (d) PB-CA-SA powder, (e) PB-SA microcapsule, and (f) PB-CA-SA microcapsule.
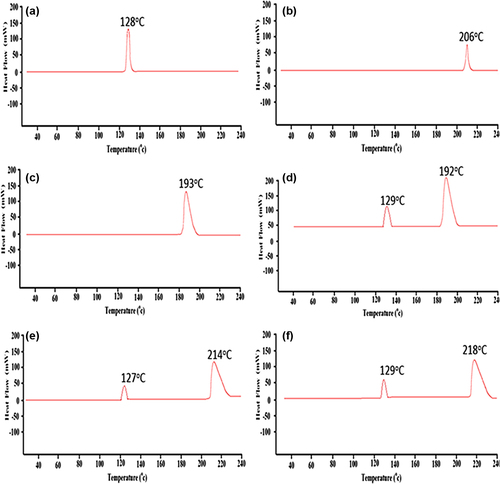
Figure 7. FTIR spectra of (a) PB powder, (b) CA powder, (c) SA powder, (d) PB-CA-SA powder, (e) PB-SA microcapsule, and (f) PB-CA-SA microcapsule.
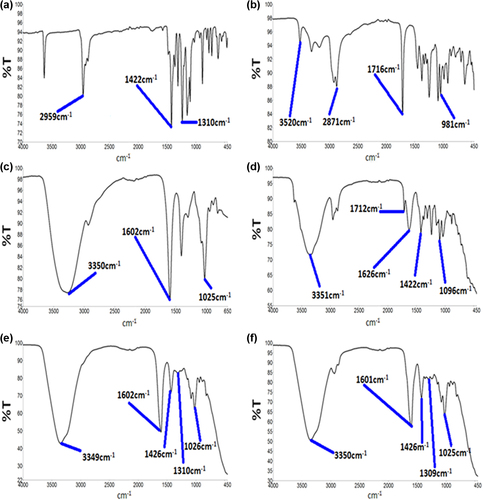
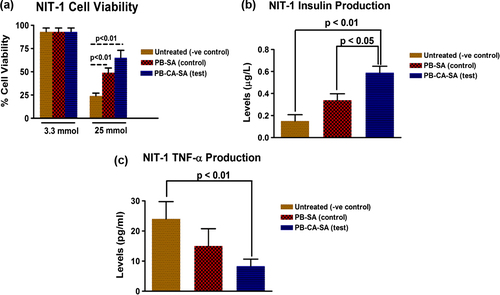
Figure 8. Cell viability at 3.3 and 25 mmol glucose (a), NIT-1 insulin production (b), and TNF-α production (c).