
Figures & data
Figure 1. Reaction scheme for the ACh determination.
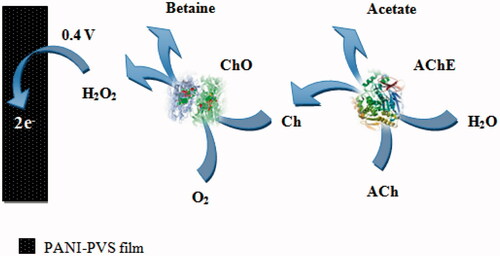
Figure 2. The effect of potential on the response of the Pt/PANI-PVS electrode to H2O2.
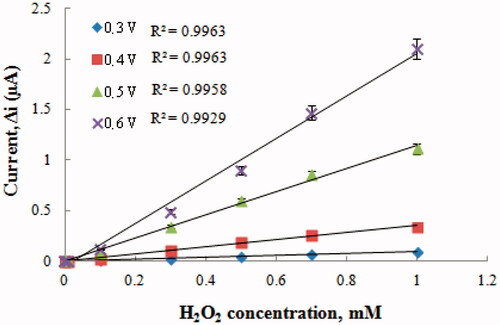
Figure 3. The effect of pH on the response of the biosensor (at 2.5 × 10⁻⁶ M ACh, at a +0.4 V operating potential). ![]()
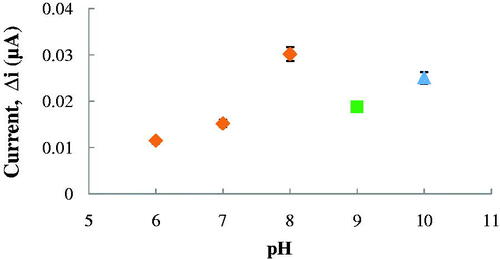
Figure 4. The effect of temperature on the response of the biosensor (at pH 8.0, 2.5 × 10⁻⁶ M ACh at a +0.4 V operating potential).
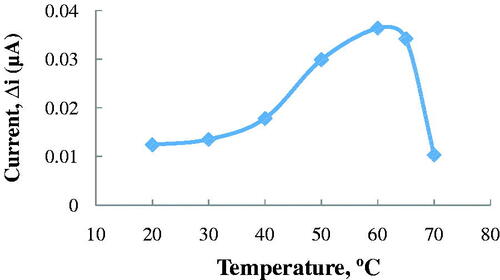
Figure 5. The effect of ACh concentration on the amperometric response of the biosensor (Michaelis–Menten plot, at 0.1 M, pH 8.0 phosphate buffer, 25 °C, +0.4 V operating potential).
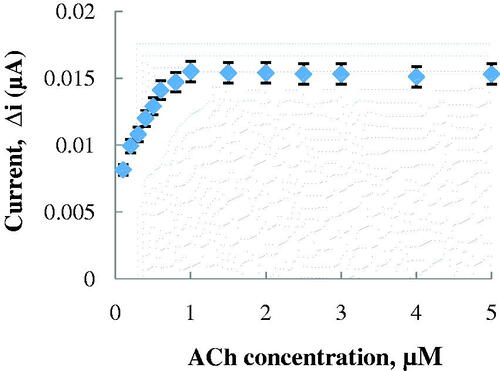
Figure 6. The calibration curve of the ACh biosensor (at pH 8.0, 25 °C).
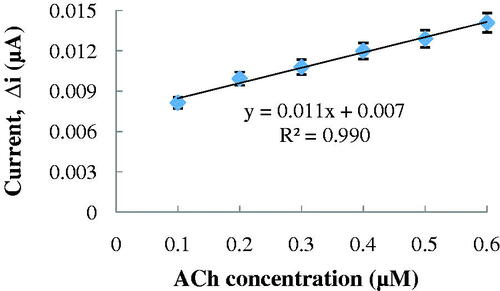
Figure 7. The effect of ACh concentration on the amperometric response of the biosensor (Lineweaver–Burk plot, at 0.1 M, pH 8.0 phosphate buffer, 25 °C, +0.4 V operating potential).
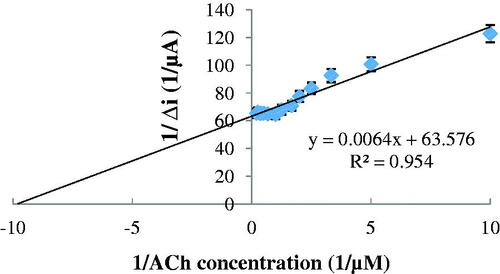
Figure 8. Operational stability of the biosensor in pH 8.0 phosphate buffer, at a +0.4 V operating potential, 25 °C.
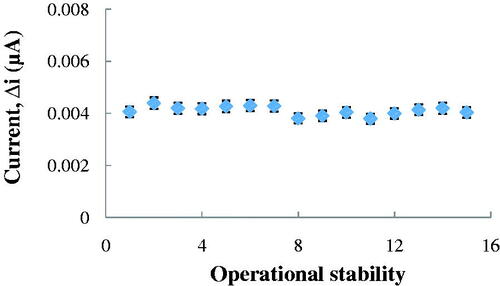
Figure 9. Storage stabilization of the biosensor pH 8.0 phosphate buffer, at a +0.4 V operating potential, 25 °C.
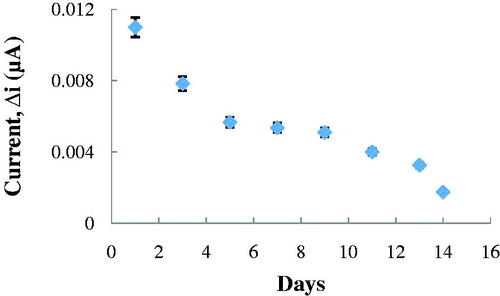
Table I. Effect of interferants on ACh biosensor.