Figures & data
Table I. Primer sequences used in real-time PCR assay.
Figure 1. Special gene characteristics of mouse BMMSCs. Immunofluorescence staining results showed that mouse BMMMSCs were positive for the CD44, ICAM-1, CD73, CD90, CD105 and SSEA-4, but negative for myocardium gene, cTnI and cTnT.
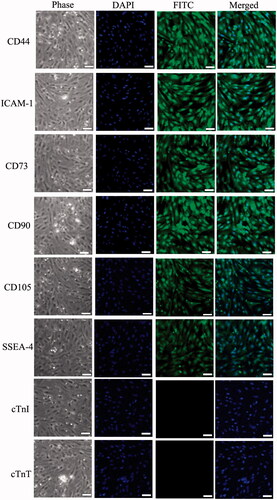
Figure 2. The target site of miRNA-1a and up-regulation of miR-1a in pre-miR-1a-transfected BMMSCs. (A) The miR-1a complementary sites with 3′-UTR of DLL 1. (B) BMMSCs were transfected with adenoviruses as described in the Methods, and the expression of miR-1a was quantified by real-time PCR. (C) Effect of miR-1a on protein level of DLL 1. (D) Quantification of DLL 1 in BMMSCs transfected with miR-1a, eGFP or control for 72 h.
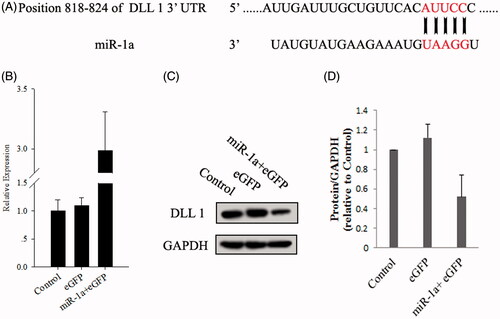
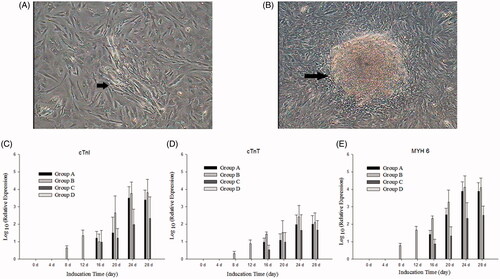
Figure 3. Cardiomyogenic differentiation of BMMSCs. (A) The cells polymerized to form myotubules after culture in group B for 12 days (arrow). (B) About 18 days later, the myotubules increased and fused to form fascicles (arrow). (C–E) Myocyte-specific genes – cTnI, cTnT and MYH 6 – were expressed after incubation in different induced groups for different induction days, whereas these genes were not detected in control cells (group D). Myocyte-specific genes showed a time-lapse increase in group A, group B and group C.