Figures & data
Table I. Actual and coded levels of independent variables and responses monitored for Box–Behnken design for paclitaxel-loaded deformable nanovesicular formulations.
Figure 1. Three-dimensional response surface plots demonstrating the effect on independent variables on the dependent variables: vesicle size, entrapment efficiency and percent cumulative drug permeation of transfersomal formulations of paclitaxel.
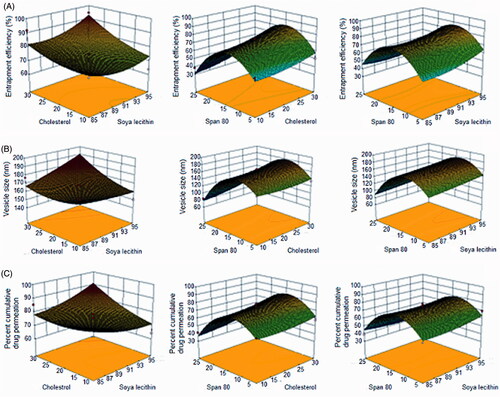
Figure 2. In vitro permeation plots of transfersomal formulations of paclitaxel.
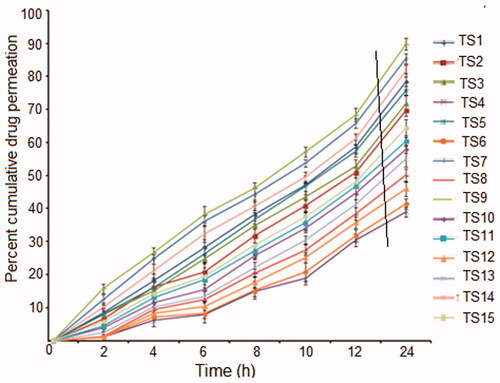
Table II. Results of model analysis and lack of fit.
Figure 3. Linear diagnostic plots (2D) plots (A, C, E) between actual and predicted values and the corresponding residual plots (B, D, F) for various responses.
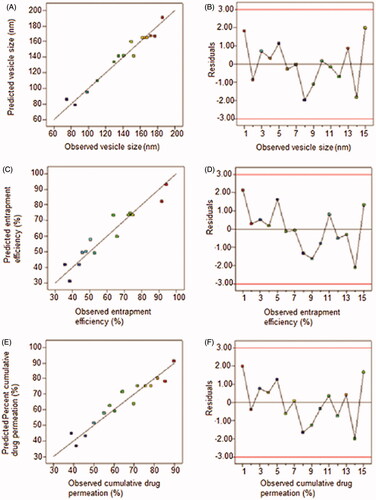
Table III. Validation of experimental model: predicted versus observed responses.
Figure 4. Transmission electron micrographs of optimized transfersomal formulation of paclitaxel (TS9).
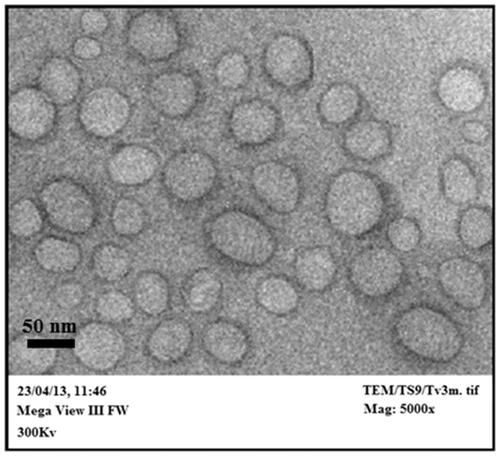
Table IV. Comparative data of transfersomal (TG) and control gel (CG).
Figure 5. Comparative ex vivo cumulative drug permeation profiles of TS9, TG and CG in phosphate buffer, pH 7.4.
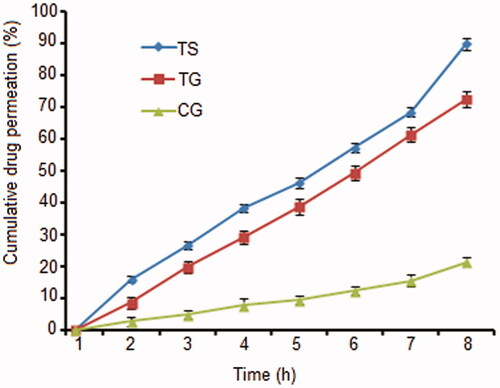
Figure 6. Percent growth inhibition graph for various treatments on KSY1 cell lines.
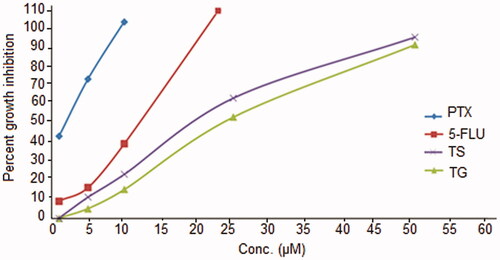
Figure 7. Confocal laser scanning micrographs of (A) control gel (CG) and (B) transfersomal gel (TG) captured using fluorescent tracer Rhodamine B across the rat skin.
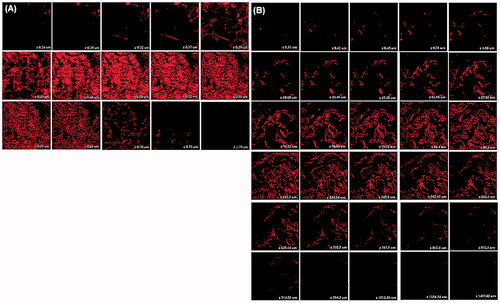
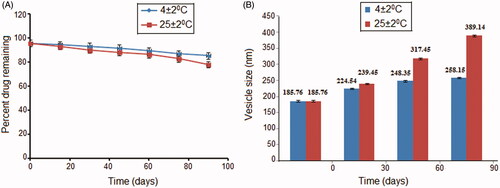
Figure 8. Effect of storage temperature on (A) drug entrapment and (B) vesicle size of TS9.