
Figures & data
Table I. Formulation of lipid components (lipid drug ratio = 3:1).
Figure 1. (A) SEM photograph of NOV-5. (B) TEM photograph of NOV-5. (C) Particle size distribution analysis report of NOV-5.
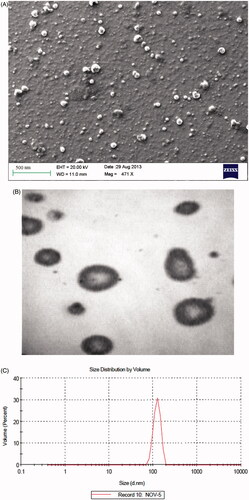
Table II. Nanovesicles and corresponding gels: physicochemical parameters.
Figure 2. In vitro drug release profile for nanovesicle formulations in 24 h. Data presented as mean ± SD; (n = 3); p ≤ 0.01.
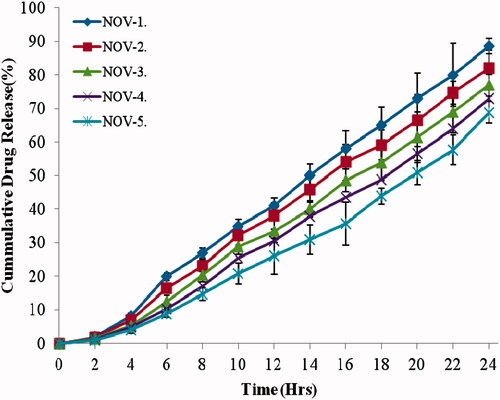
Table III. Physicochemical characterization of nitrendipine ceramide oleic vesicles (NOV-5) after stability studies.
Figure 3. Cumulative amount of drug permeated per unit area through human skin in 24 h. Data presented as mean ± SD; (n = 6); p ≤ 0.05.
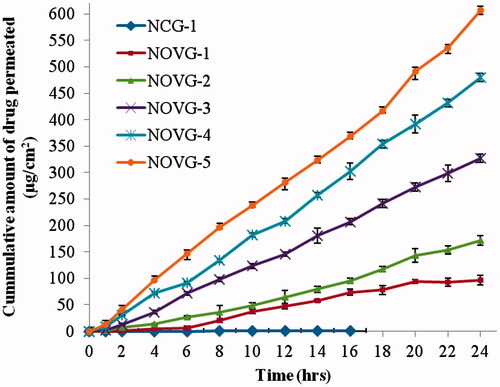
Table IV. Flux, permeability coefficient and diffusion parameters of NOVG formulations.
Figure 4. Drug concentration in various strata of skin; SC, stratum corneum; VED, viable epidermis; D, dermis; RC, receiver chamber. Data presented as mean ± SD; (n = 6); p ≤ 0.05.
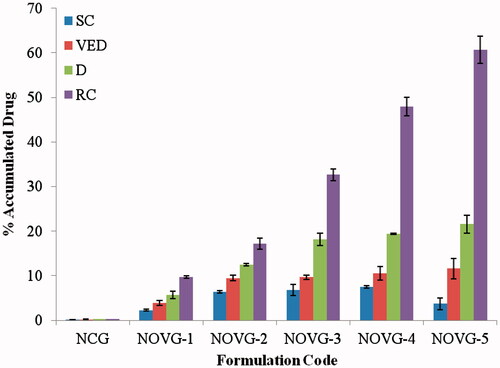
Figure 5. Plasma drug concentration profiles of NOVG-5, NOS and NCG. Data presented as mean ± SD; (n = 6); p ≤ 0.05.
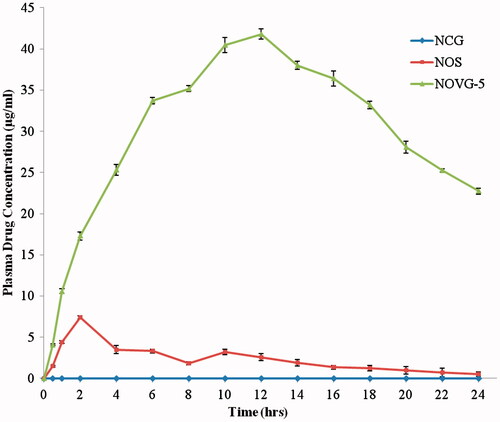
Table V. Cmax, tmax and AUC0→24 values for NOS, NCG and NOVG formulations.
Table VI. Antihypertensive effect of NOVG-5 and NCG in comparison to oral route.