Figures & data
Figure 1. MTOR is a direct target of miR-634. (1A) the expression level of miR-634 in HeLa and SiHa cells was significantly altered following transfection with either pri-miR-634 or ASO-miR-634 expression constructs as determined by qRT-PCR using U6 snRNA for normalization. (1B) the intensity of EGFP fluorescence in HeLa cells transfected with pri-miR-634 was decreased after 48 h and increased following transfection with ASO-miR-634. (1C) pri-miR-634 and ASO-miR-634 had no effect on the intensity of EGFP fluorescence in cells transfected with the 3′-UTR mutant vector. (1D) mRNA expression in HeLa and SiHa cells resulted from MiR-634 and miR-634 ASO with pcDNA3 or ASO-NC to be the respective controls. (1E) mTOR expression in HeLa and SiHa cells resulted from MiR-634 and miR-634 ASO with pcDNA3 or ASO-NC to be the respective controls. (*, p < 0.05, **, p < 0.005).
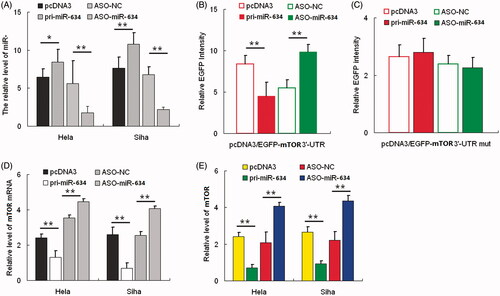
Figure 2. miR-634 represses cell proliferation and migration and invasiveness. Cervical cancer cells were transfected with either pri-miR-634 or ASO-miR-634. Cell viability was determined at 24, 48, and 72 h after seeding in 96-well plates using the CCK8 assay. (2A)the histogram shows the data at the time point of 48 h. All three data points showed a significant difference. (2B)cervical cancer cells were transfected with pri-miR-634 or ASO-miR-634 and then seeded in 12-well plates. For the colony formation assay, the cells were stained with 2% crystal violet solution, and a representative image is shown. (2C) and (2D) migration and invasion assays were performed with HeLa and SiHa cells transfected with either pri-miR-634 or ASO-miR-634. Representative images and randomly selected fields are shown. Knockdown of MTOR suppresses proliferation, migration, and invasiveness of cervical cancer cells. (2E), MTOR protein level was measured by Western blotting 48 h after transfection of siR-MTOR into HeLa and SiHa cells. GAPDH was used as loading/transfer control (Ctrl) and for normalization of values. (2F) Viability and proliferation of Hela and SiHa cells resulted from siR-mTOR with SiR as controls. (2G) Colony formation in HeLa and SiHa cells resulted from siR-mTOR with SiR as controls. (2H) Migration of Hela and SiHa cells resulted from siR-mTOR with SiR as controls. (2I) Invasive potential in HeLa and SiHa cells resulted from siR-mTOR with SiR as controls.(*, p < 0.05; **, p < 0.005).
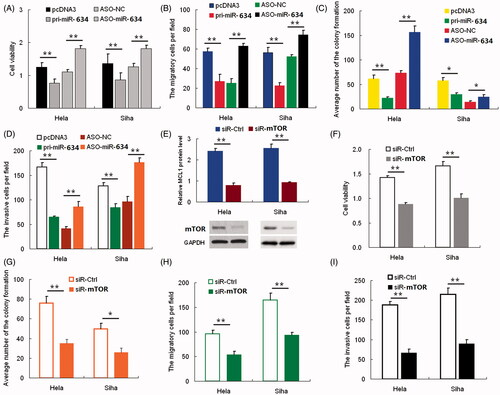
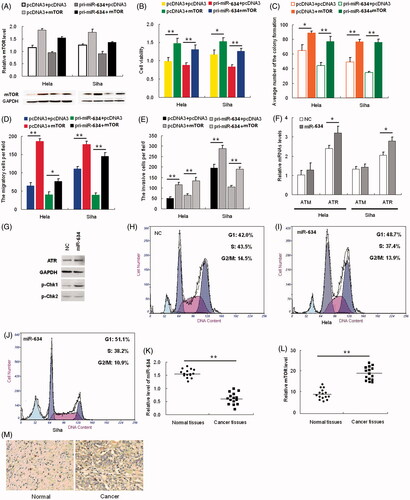
Figure 3. mTOR rescues miR-634-induced cellular phenotypes in cervical cancer cells. Hela and SiHa cells were either transfected with pcDNA3+pcDNA3, pcDNA3+mTOR, pri-miR-634+pcDNA3 or pri-miR-634+mTOR plasmids; (3A) Western blot was used to assess mTOR protein expression. The upper panel shows grayscale ratios mTOR and GAPDH. GAPDH was used as the loading control. (3B) Viability and proliferation of Hela and SiHa cells treated as indicated were measured by CCK-8 assay. (3C) Colony formation assay was used to analyze the colony formation capacity of Hela and SiHa cells treated as indicated. Quantification of the colony number in each treatment group is shown as histograms. (3D) Transwell chambers were used to assess the migratory capacity of Hela and SiHa cells treated as indicated. The number of migrating cells, averaged over five randomly selected fields of view, was quantified. (3E) Matrigel invasion chambers were used to assess the invasiveness of Hela and SiHa cells treated as indicated. The number of invading cells was counted and averaged over five randomly selected fields of view. (3F) Real-time PCR was used to determine relative ATM and ATR mRNA levels in Hela and SiHa cells transfected with or without miR-634 plasmid. (3G) Levels of ATR and p-Chk1 and p-Chk2 were analyzed by western blot. GAPDH was used as the loading control. (3H-J) The cell cycle distribution of Hela cells in each treatment group was analyzed by flow cytometry. (3K-L) The relative miR-634 and mTOR mRNA levels in 15 pairs of cervical cancer tissues and respective adjacent non-cancerous tissues were analyzed by Real-time PCR. Each circle or square represents a single sample, and the line represents the mean value of each category. (M) Representative images showing mTOR immunostaining levels in cervical cancer and non-cancerous tissues. Nuclei are counterstained with hematoxylin.