Figures & data
Figure 1. Flow cytometric analysis of CD42b and CD61 expressions on PMPs. (A) Iso type negative control. (B) Dual positive for CD42b and CD61, 73.70%. (C) CD42b-FITC: 74.72%. (D) CD61-PE: 93.33%.
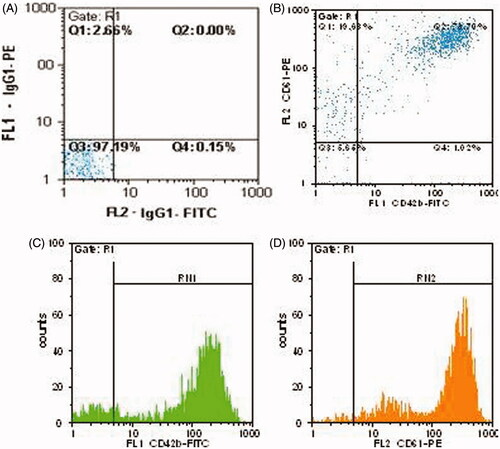
Figure 2. Flow cytometric analysis of CD133, CD34, and CXCR4 expressions on fresh HSCs. (A) Iso type negative control. (B) CD133-PE. (C) CD34-FITC. (D) CDCXCR4-PE.
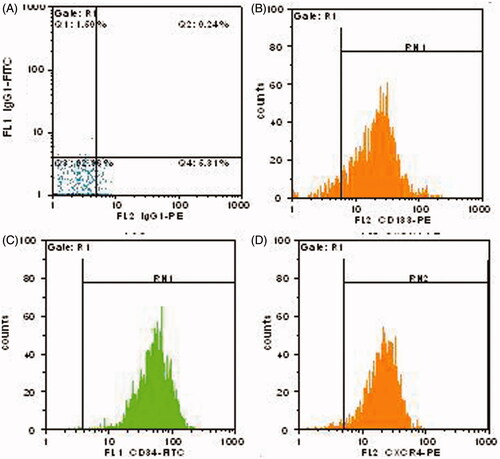
Figure 3. Proliferation analysis of treated and un-treated CD133+ cells at day 5 of culture. There were no significant differences between two groups of culture and controls (n = 6, P > 0.05).
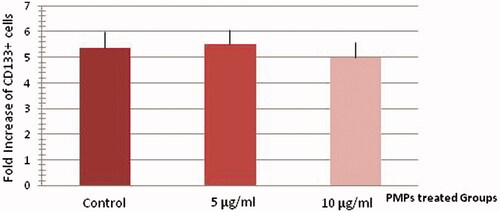
Figure 4. Proliferation analysis of treated and un-treated CD34+ cells at day 5 of culture. The mean fold change of treated CD34+ cells with PMPs was higher than control CD34+ cells at day 5 of culture (n = 6, P < 0.05).
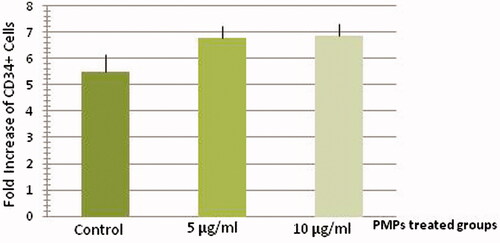
Figure 5. CXCR4 expression analysis of treated HSCs with PMPs. The mean fold change of treated CXCR4+ cells with 10 µg/ml PMPs was higher than the mean fold change of control cells at day 5 of culture (n = 6, P < 0.05).
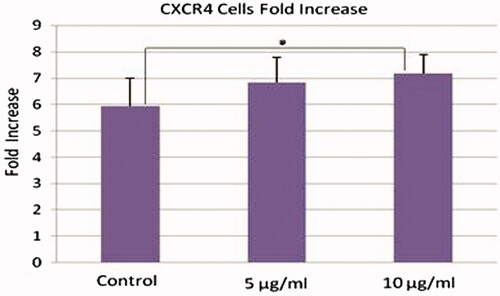
Figure 6. CD34-CXCR4 co-expression analysis of HSCs after treatment with PMPs. The mean fold change of treated dual positive CXCR4, CD34+ cells with PMPs was higher than control CXCR4, CD34+ cells at day 5 of culture (n = 6, P < 0.05).
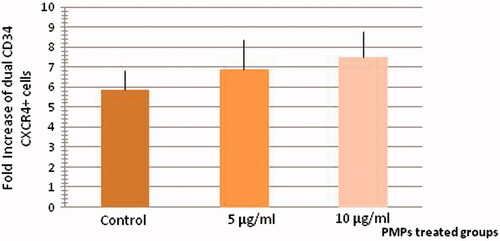
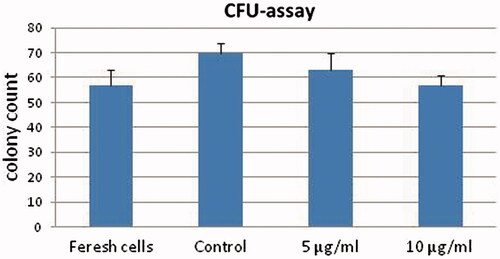
Figure 7. Colony-forming cell assays of HSCs before and after treatment with PMPs (n = 6, P < 0.05).