
Figures & data
Figure 1. Reaction mixture after incubation period containing gold nanoparticles (a), control (b) and containing silver nanoparticles (c). UV–Vis spectra of the reaction mixture of gold nanoparticles (d), reaction mixture of silver nanoparticles (e).
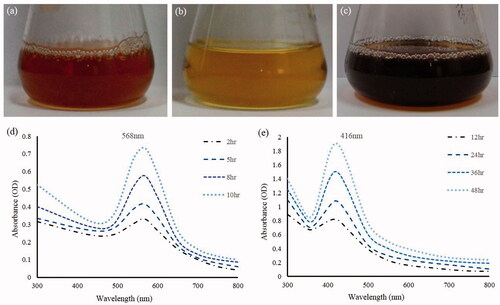
Figure 2. TEM image of gold nanoparticles at 10 nm (a), at 20 nm (b), silver nanoparticles at 10 nm (c), at 20 nm (d).
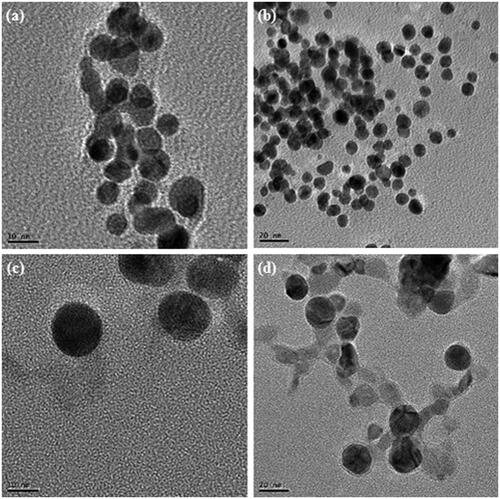
Figure 3. EDX spectrum of gold nanoparticles (a), elemental mapping: electron micrograph region of gold nanoparticles (b), distribution of gold element (c). EDX spectrum of silver nanoparticles (d), elemental mapping: electron micrograph region of silver nanoparticles (e), distribution of silver element (f).
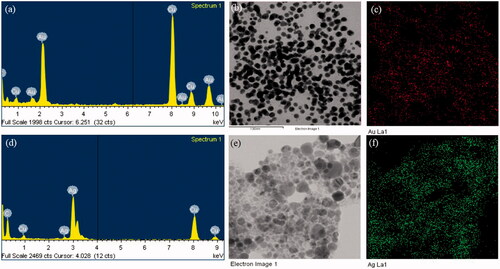
Figure 4. Particles size distribution of gold nanoparticles according to intensity (a), number (b), and volume (c); and silver nanoparticles according to intensity (d), number (e), and volume (f).
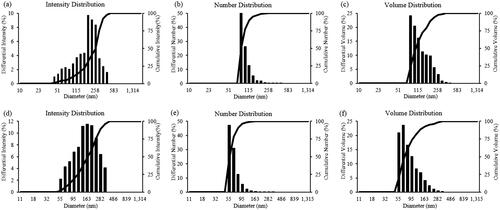
Figure 5. Antimicrobial activity of nanoparticles in comparison with antibiotics against V. parahaemolyticus, S. enterica, S. aureus, B.anthracis, B.cereus, E. coli, and C. albicans. Note: P10, penicillin G 10 μg/disk; OL15, oleandomycin 15 μg/disk; MY15, lincomycin 15 μg/disk; cycloheximide, 10 μg/disk; AuNPs, gold nanoparticles, 30 μl (100 mg/l); AgNPs, silver nanoparticles, 30 μl (100 mg/l).
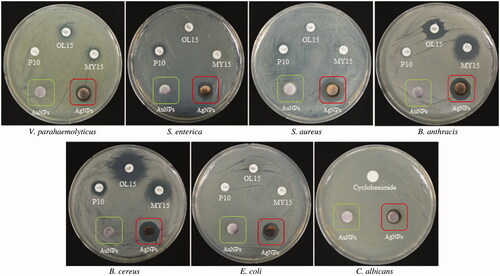
Table I. Antimicrobial activity of nanoparticles against V. parahaemolyticus, S. enterica, S. aureus, B. anthracis, B. cereus, E. coli, and C. albicans.