Figures & data
Figure 1. The structures of three thiols used in this study and schematic representation of the SAM surfaces of gold, modified with 11-mercaptoundecanoic acid (I), 2-mercaptoethanol (II) and 2-mercaptoethylamine (III).
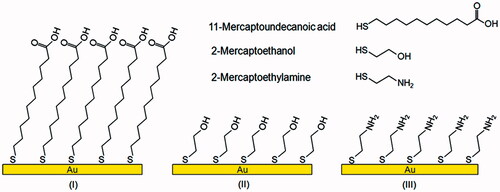
Figure 2. Experimental set-up of the real-time QCM detection system and the quartz crystal.
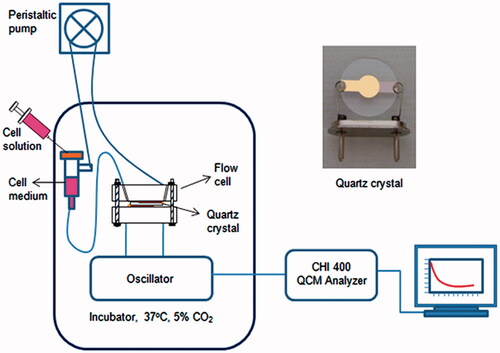
Table I. Frequency shifts of modified/coated crystals.
Figure 3. The three-dimensional AFM images of uncoated (a), 11-MUA (b), 2-mercaptoethanol (c), and 2-mercaptoethylamine (d) modified, and PLGA nanofiber (e), PLGA film (f), PCL film (g), and PS film (h) coated crystal surfaces.
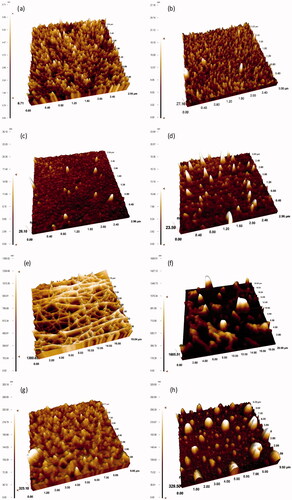
Table II. The average RMS values of surfaces used in this work.
Figure 4. Representative phase-contrast microscopy images demonstrating the morphological characteristics of MSCs (a) and MSCs treated with vinblastine concentration of 50 μM (b), 100 μM (c), 150 μM (d), 200 μM (e), 250 μM (f). Scale bars: 100 μm.
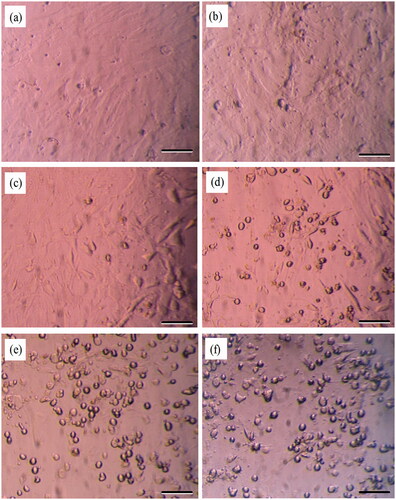
Figure 5. Resonance frequency shift of the uncoated (a) and 11-MUA (b), 2-mercaptoethanol (c), 2-mercaptoethylamine (d), PLGA nanofiber (e), PLGA film (f), PCL (g) and PS (h) coated crystal surfaces upon the addition of culture medium (I) and MSC suspension (II) for 4 h at 37 °C.
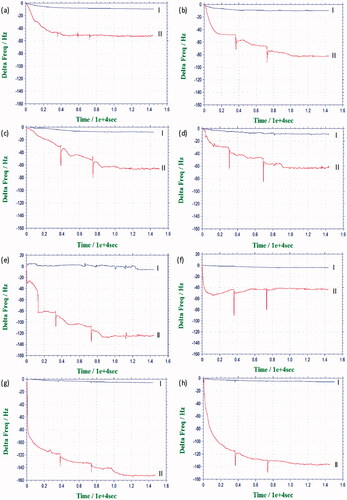
Figure 6. The phase-contrast microscopy images of the uncoated (a) and 11-MUA (b), 2-mercaptoethanol (c), 2-mercaptoethylamine (d), PLGA nanofiber (e), PLGA film (f), PCL (g) and PS (h) coated crystal surfaces after the cell–substrate interaction experiments. Scale bars: 100 μm.
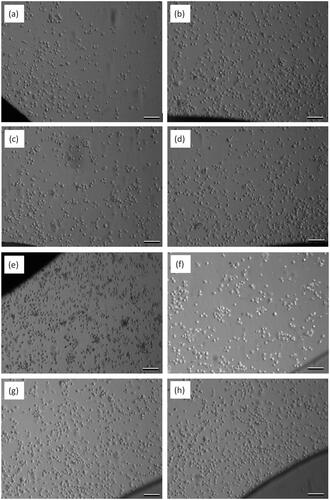
Figure 7. Effect of vinblastine on the mitochondrial activity of MSCs. Cells were treated with 50, 100, 150, 200 and 250 μM of vinblastine for 6 h.
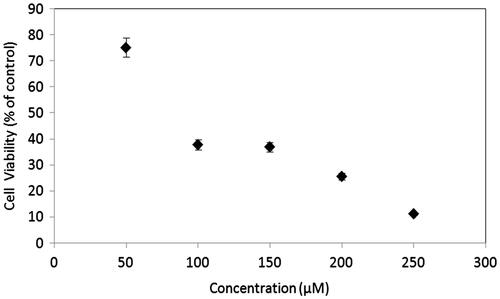
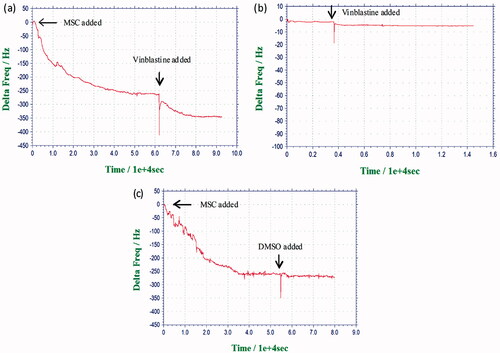
Figure 8. (a) Resonance frequency shifts of the PS-coated quartz crystal in response to the addition of MSCs at first arrow, vinblastine addition at second arrow. (b) Resonance frequency shifts of the PS-coated quartz crystal in response to the addition of vinblastine at first arrow. (c) Resonance frequency shift of the quartz crystal in response to the addition of MSCs (first arrow), and DMSO addition (second arrow).