
Figures & data
Figure 1. Mechanism of oxidation of 2, 6-dimethoxy phenol by laccase.
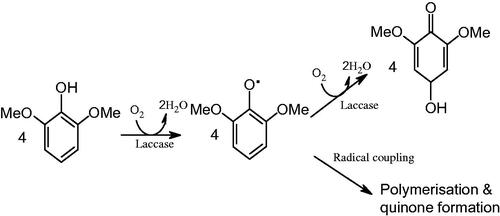
Figure 2. Biosensor configuration.
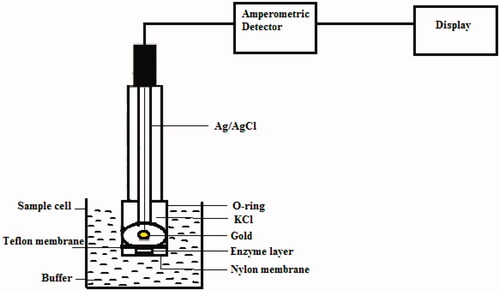
Figure 3. Optimum pH for biosensor performance.
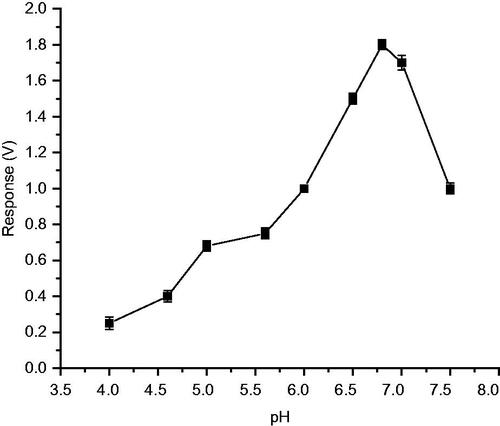
Figure 4. Optimum temperature for biosensor performance.
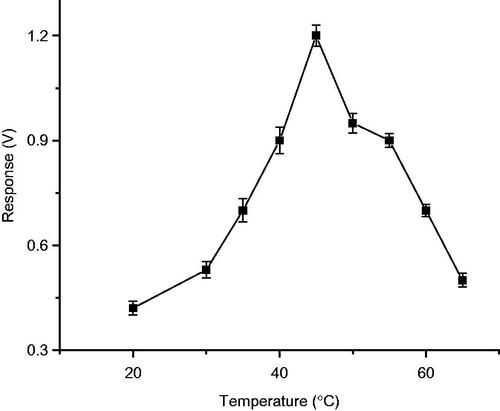
Figure 5. Effect of molarity of buffer on biosensor response.
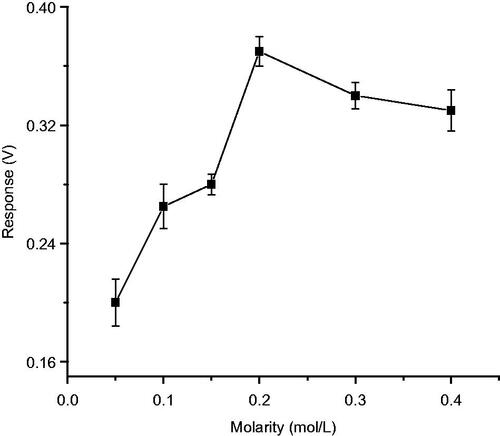
Figure 6. Effect of glutaraldehyde concentration on biosensor response in cross-linking method.
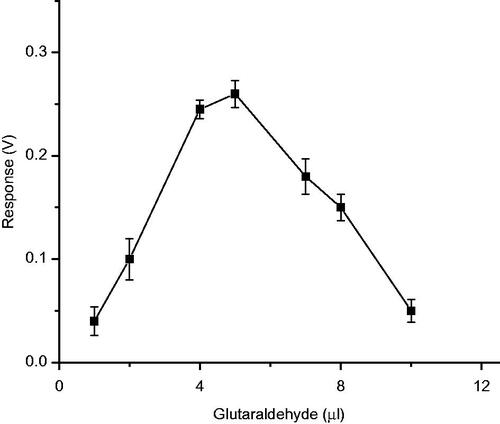
Table I. Factors and levels in Box–Behnken design.
Table II. Coded-level combinations for a three-level, three-variable experimental design.
Figure 7. Comparison between the observed values and the predicted values of BBD.
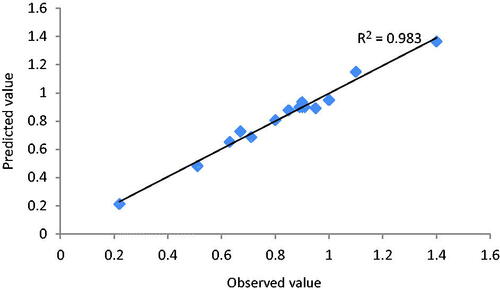
Table III. ANOVA table for the RSM model.
Table IV. Regression statistics.
Figure 8. Response surface plots showing the effects of factors (concentrations of laccase (A), BSA (B), and glutaraldehyde (C)) on the response.
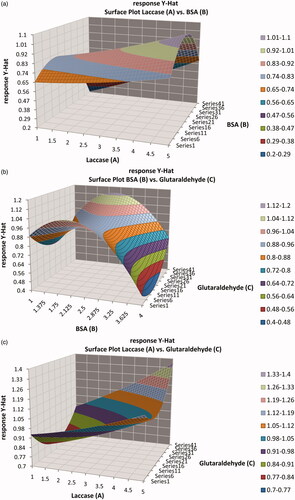
Figure 9. Contour plot showing the ranges of concentration of laccase and BSA to obtain various response values taking concentration of glutaraldehyde constant.
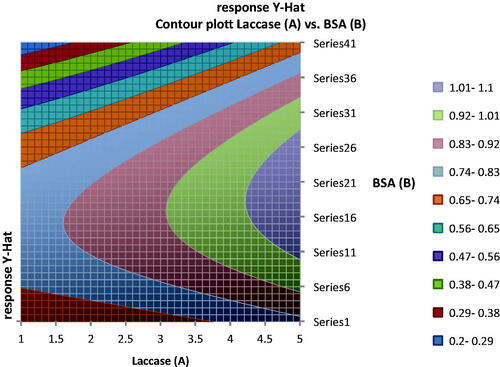
Table V. Predicted and experimental value for the responses at the optimum conditions.
Figure 10. Calibration graph for 2, 6-dimethoxy phenol with test biosensor using laccase (5 IU) immobilized with BSA (2.5 mg) and glutaraldehyde (5%–20 μl).
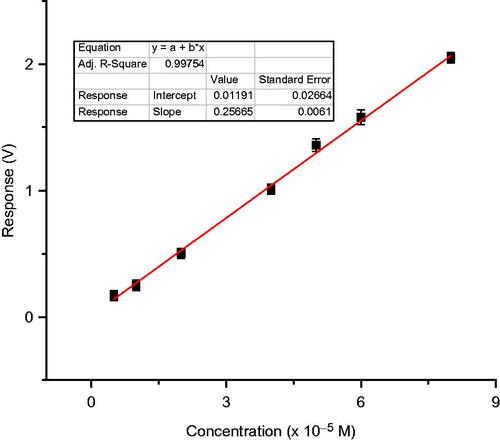
Figure 11. Operational stability of laccase-based enzyme electrode for various immobilization methods on nylon membrane.
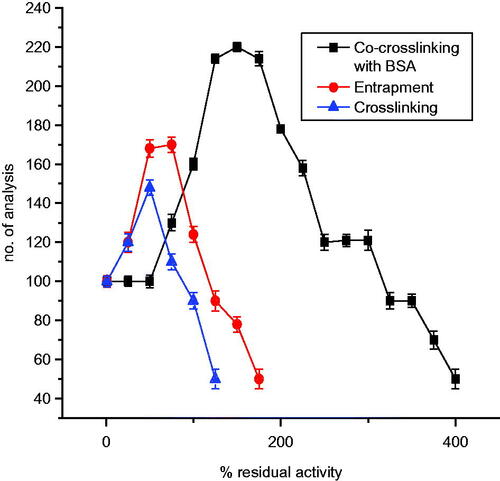
Figure 12. Calibration graph of laccase-based amperometric biosensor for 2,6-dimethoxy phenol using biosensor employing various immobilization methods on nylon membrane.
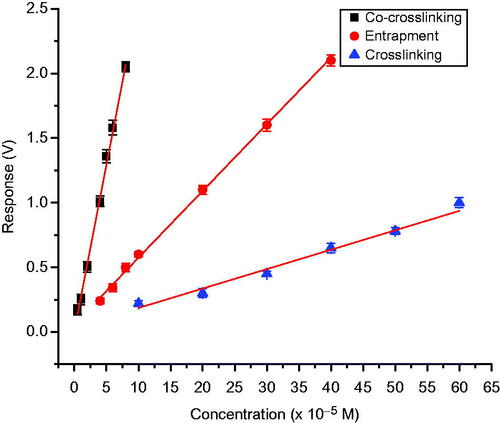
Table VI. Calibration data for methyl and methoxy disubstituted phenolic compounds using laccase biosensor employing various immobilization methods on nylon membrane.
Figure 13. Calibration graph of laccase-based amperometric biosensor for different methyl and methoxy substituted phenols using co-cross-linking with BSA and glutaraldehyde.
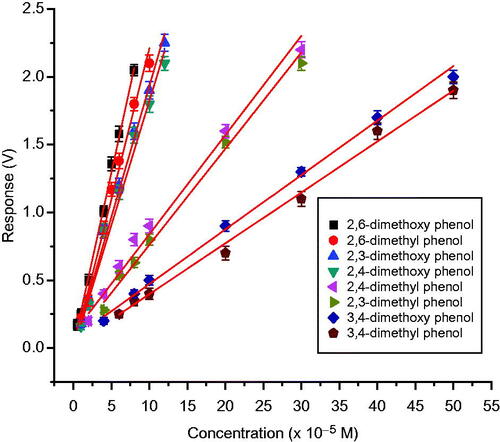
Table VII. Statistical analysis of biosensor response to varying concentration of catechol for the various type of immobilization.
Table VIII. A comparison of properties of various enzyme based phenol biosensors.
Table IX. Simulated effluent sample analysis using test biosensor.