Figures & data
Figure 1. Schematic illustration of synthesis root of tri-block (PCL–PEG–PCL) copolymer.
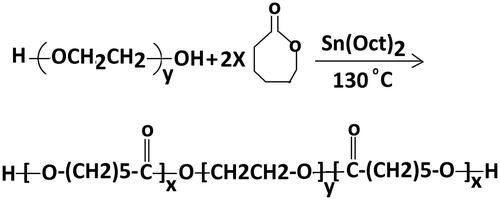
Figure 2. 1HNMR spectrum of PCL–PEG–PCL co-polymer.
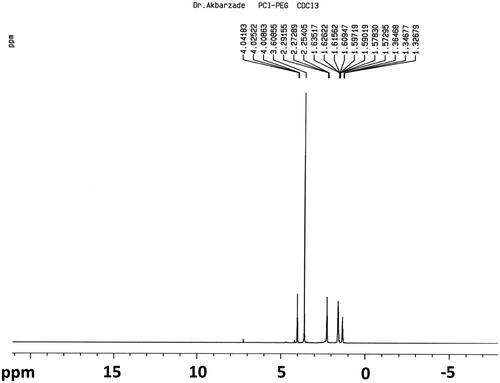
Figure 3. The FTIR spectra of (a) Fe3O4, (b) CUR, (c) SIL, (d) PCL–PEG–PCL, (e) CUR–SIL loaded PCL–PEG–PCL MNPs.
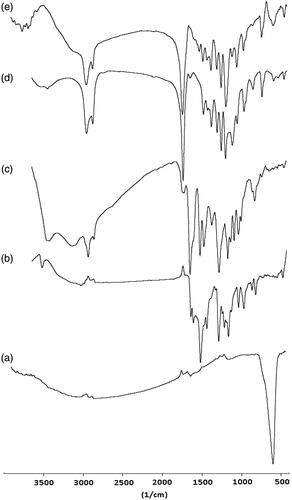
Figure 4. (a) Fe3O4, (b) VSM test of Fe3O4–PCL–PEG–silibinin–curcumin.
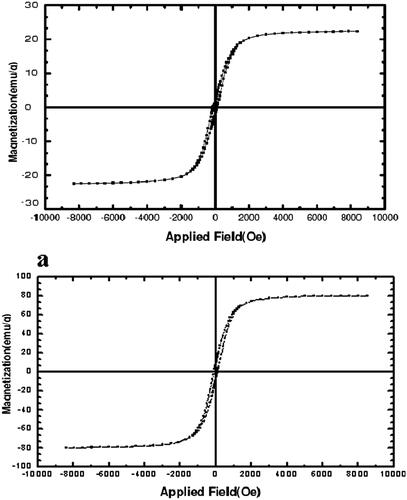
Figure 5. (a) The SEM micrographs of pure Fe3O4 nanoparticles, (b) The SEM micrographs of PCL–PEG coated Fe3O4 nanoparticles.
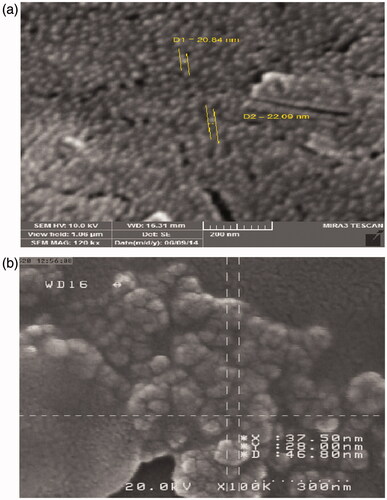
Figure 6. Cytotoxicity study of CUR–SIL and CUR–SIL-loaded PCL–PEG–PCL MNPs on A549 cell line (in vitro) after, 24 h (a), 48 h (b), and 72 h (c) exposure.
Figure 7. Cell viability study of CUR–SIL and CUR–SIL-loaded PCL–PEG–PCL MNPs on A549 cell line after (a) 24 h, (b) 48 h, and (c) 72 h.
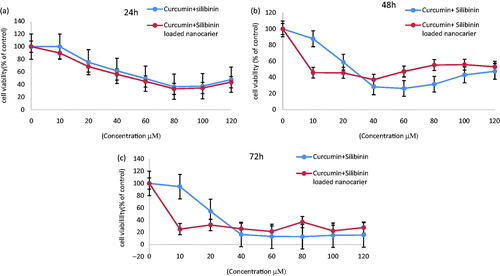
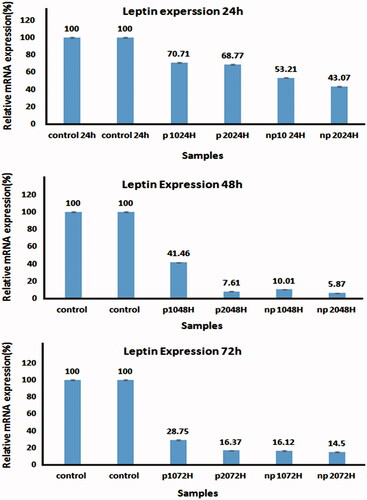
Figure 8. Quantitative real-time PCR results for control and different concentrations of free CUR–SIL and CUR–SIL loaded PCL–PEG MNPs on after (a) 24 h, (b) 48 h, and (c) 72 h exposure with A549 cell lines.