Figures & data
Figure 1. ZnS nanoparticles were biologically synthesized using bacterial biomass and it was characterized by various techniques. (A) The absorbance of ZnS-NPs was analysed by UV visible spectrophotometer and the peak was observed at 346 nm. (B) The crystal formation of nanoparticles was analysed by XRD. (C) The major peaks (3402.20 cm−1, 2368.78 cm−1, 1527.52 cm−1, 1662.88 cm−1, 1062.70 cm−1 and 675.04 cm−1) attained from the FTIR spectrum represents the functional groups of ZnS nanoparticles.
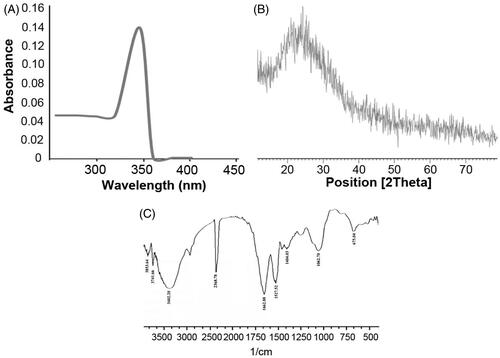
Figure 2. The structural analysis of ZnS nanoparticles by TEM. (A) TEM image confirms the morphology and size of the nanoparticles as spherical and 50 nm. (B) Size distribution of ZnS nanoparticles. (C) Zeta potential of ZnS nanoparticles.
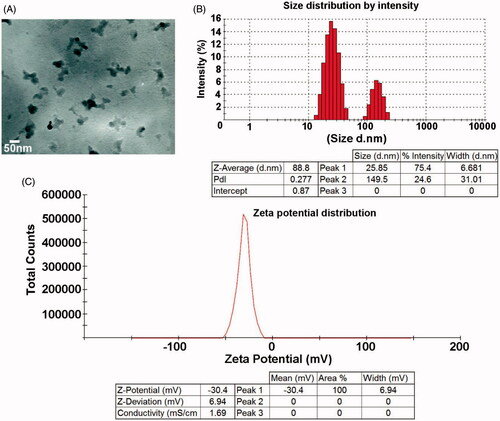
Figure 3. Cytotoxic effect of ZnS-NPs on MRPE cells. (A) MRPE cells were treated with various concentrations of ZnS-NPs and cell viability was measured after 24, 48 and 72 h. (B) MRPE cells were treated with various concentrations of ZnS-NPs and morphological changes were observed by phase contrast microscope. Higher doses of ZnS-NPs-induced (800 nM and 1000 nM) morphological alteration at 24 h.
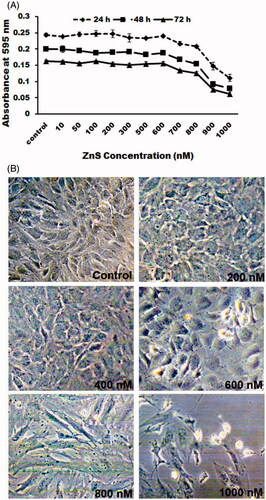
Figure 4. Dose- and time-dependent effect of ZnS-NPs on MRPE cell permeability. MRPE cells were grown to confluent monolayers on porous membranes (12-well transwell insert) and treated with ZnS-NPs and the flux of RITC-dextran from the upper to the lower chamber was measured 6, 12, 18 and 24 h after treatment. Values are expressed in relative fluorescence units (RFUs) as mean ± SEM, with each condition performed at least in triplicate.
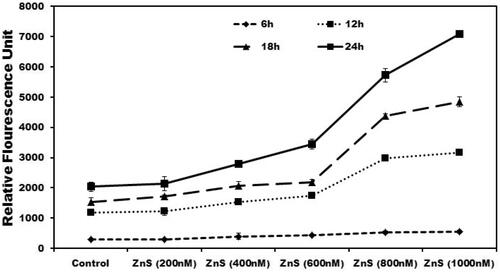
Figure 5. Dose-dependent effect of ZnS-NPs on ROS elevation in MRPE cells. (A) There was no fluorescence indication of ROS generation at minimal concentrations (200, 400 and 600 nM) of ZnS-NPs in treated MRPE cells. (B) Relative fluorescence unit shows that the ROS generation was increased in higher concentrations (800 and 1000 nM) of ZnS-NPs-treated MRPE cells when compared with control and lower concentrations. Values are expressed in relative fluorescence unit (RFU) as mean ± SEM, with each condition performed in triplicate (n=3, *P<0.05 V control, **P<0.01 V control).
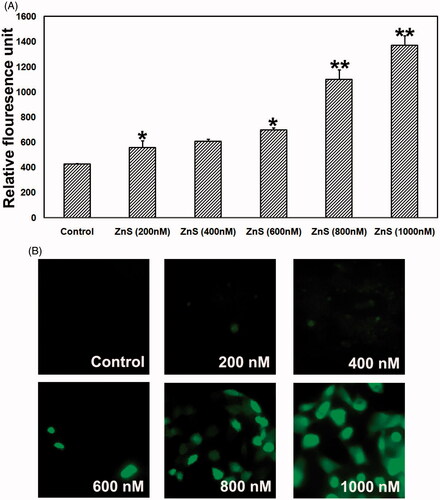
Figure 6. The patterns of cell damage were assessed using an acridine orange/ethidium bromide differential staining method. Images show AO/EtBr staining of control and MRPE cells treated with various doses of ZnS-NPs. Green cells indicate live cells and red or yellow–red indicate apoptotic cells. All experiments were repeated three times with similar results.
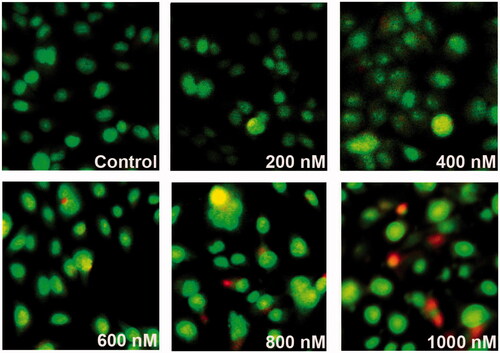
Figure 7. FACS analysis of primary MRPE cells after exposure to different concentrations of ZnS-NPs for 24 h. (A) Cells treated with 200 nM. (B) Cells treated with 400 nM. (C) Cells treated with 600 nM. (D) Cells treated with 800 nM. (E) Cells treated with 1000 nM. (F) Graph representing the percentage of apoptotic cells. Results are representative from three independent experiments. The standard deviations are shown.
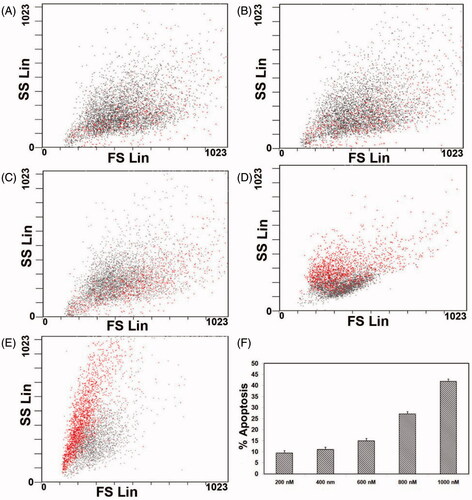
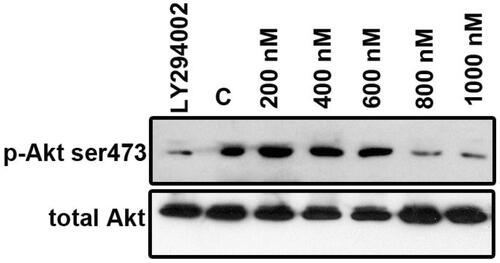
Figure 8. ZnS-NPs regulate Akt phosphorylation (Ser473) in MRPE cells. MRPE cells were pre-treated with various concentrations of ZnS-NPs and Akt phosphorylation inhibitor LY294002 (10 μM) and analysed by western blotting using phospho-specific Akt antibody. 0.5% FBS-availed cells were used as control. As a loading control, same samples were analysed using total Akt antibody. These experiments were performed thrice with similar results and significant differences from control group were observed.