Figures & data
Figure 1. Shcematic representation of doxorubicin beairng FA-CHI conjugated QDs and their function.
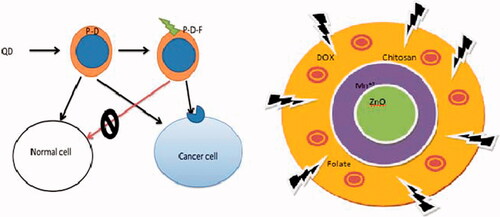
Figure 2. Synthesis scheme of DOX/FA/CHI-QDs.
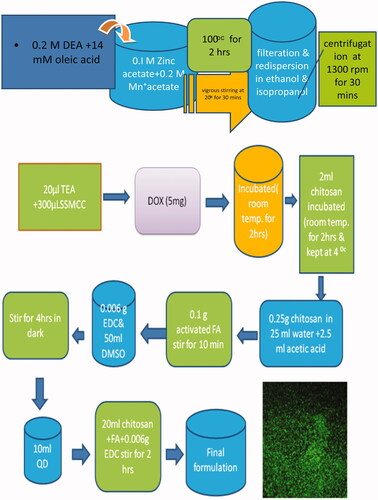
Figure 3. (A) UV spectroscopy of prepared QDs. FTIR spectroscopy of (B) NHS activated FA, (C) prepared QDs, and (D) DOX/FA-CS-QDs.
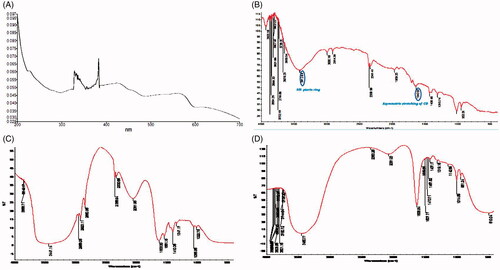
Figure 4. Motic microscopic image of synthesized QDs at different magnifications.
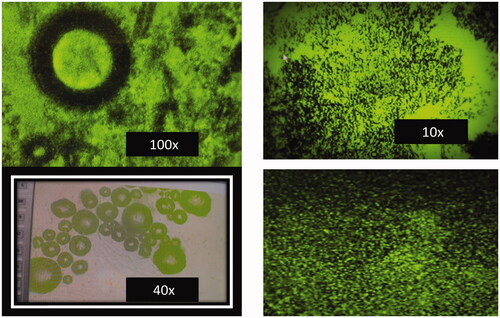
Figure 5. Percent cumulative DOX release from the QDs formulations at pH 5.0 and 7.4. Values represent mean ± S.D. (n=3).
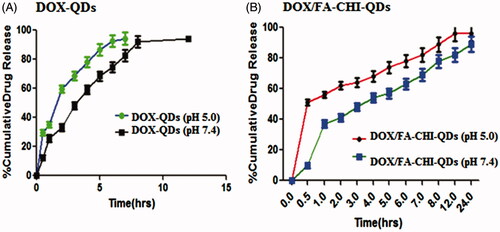
Figure 6. Percent cell viability of DOX, DOX-QDs and DOX/FA-CHI-QDs final formulations.
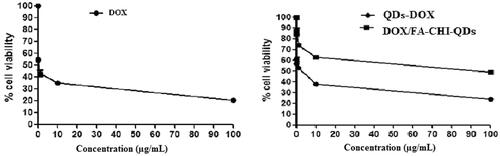
Figure 7. The fluorescence images of the treated MCF-7 cell lines with DOX, DOX-QDs and DOX/FA-CHI-QDs formulations.
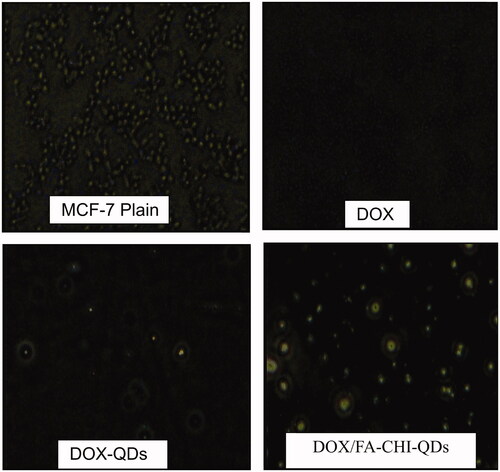
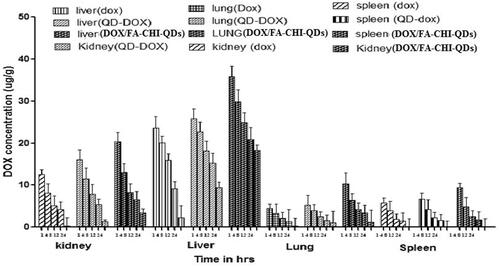
Figure 8. Tissue-organ biodistribution study for DOX, DOX-QDs and DOX/FA-CHI-QDs different formulation.