Figures & data
Table I. Experimental runs obtained from Box–Behnken design and their actual and predicted responses for tramadol nanoethosomal formulations.
Figure 1. 3D-Response surface plots showing the influence of independent variables (Cholesterol, Span60, and phospholipid) on size (A–B), entrapment efficiency (C–D) and flux (E–F) for TRM ethosomes.
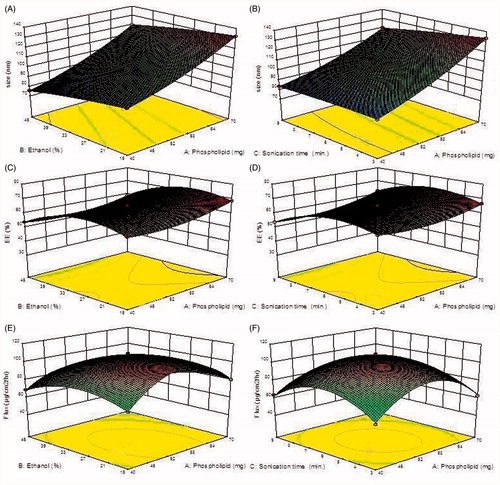
Table II. Summary of regression analysis for responses Y1 [Size (nm)], Y2 [Entrapment efficiency (%)], and Y3 [Flux (μg/cm2/h)] for fitting to different models.
Figure 2. Linear correlation graph of actual versus predicted value, (A) particle size, (B) entrapment efficiency, (C) flux.
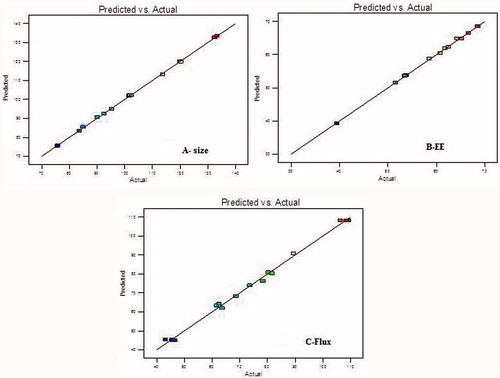
Figure 3. (A) Size distribution of optimized TRM ethosomes (B) Transmission electron micrography following negative staining (80,000×).
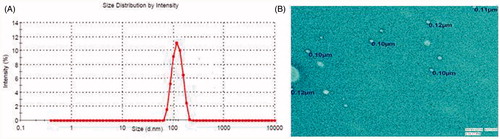
Figure 4. Confocal laser microscopy of Rhodamine loaded (A) liposome formulation (B) nanoethosome formulation (100×).
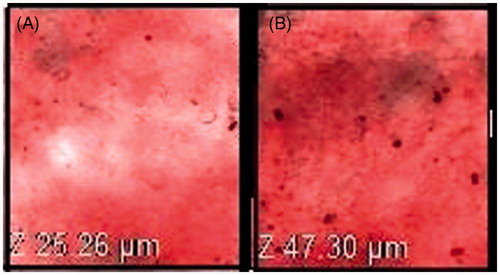
Figure 5. Histopathological image of (A) Control (B) formalin treated (C) TRM loaded nanoethosomal gel (400×).
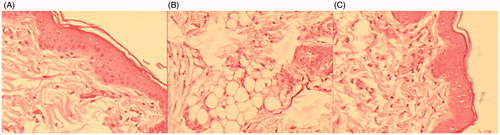
Table III. Comparative skin irritation score after application of test formulation and standard irritant.
Table IV. Absorption profile of tramadol in rats after administration different formulations (mean ± SD, n = 6).
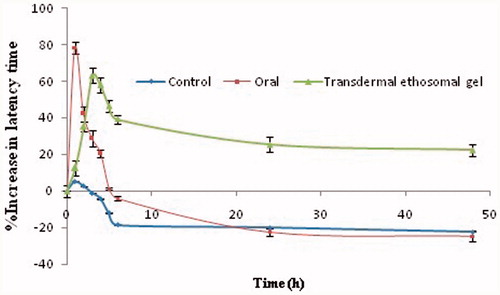
Figure 6. In vivo analgesic activity of optimized TRM loaded nanoethosomal gel and oral solution (Mean ± SD, n = 6).