Figures & data
Figure 1. Schematic illustrations of PEG-PPD conjugate synthesis. (A) Graphical illustration of PPD release from PEG-PPD conjugate at the intracellular environment. (B) mPEG-COOH was initially prepared using succinic anhydride, DMAP, and TEA. Then mPEG-COOH, DCC, and DMAP with PPD were added to obtain PEG-PPD conjugate.
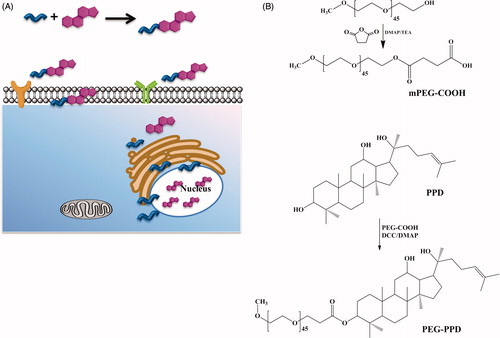
Figure 2. Characterization of PEG-PPD conjugates and its intermediates by 1H NMR spectra. (A) PEG-COOH, (B) PPD, and (C) PEG-PPD.
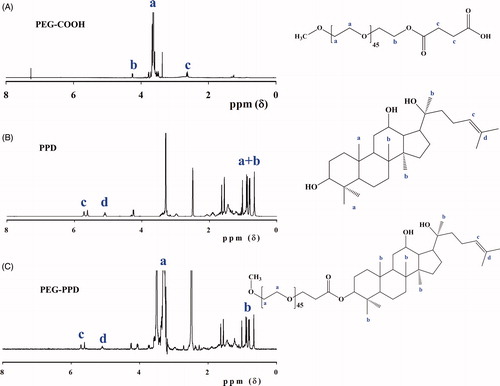
Figure 3. Characterization of PEG-PPD conjugates and its intermediates by FTIR spectra. (A) PEG-COOH, (B) PPD, and (C) PEG-PPD.
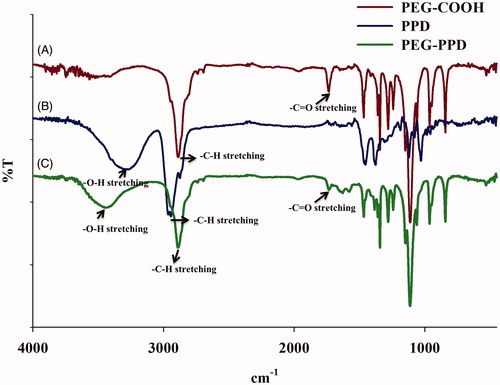
Figure 4. Physiochemical characterization of PEG-PPD conjugates. (A) Particle size of PEG-PPD conjugate. (B) The spherical shaped PEG-PPD conjugates observed in TEM images. The scale bar represents 200 nm. (C) In vitro pH-dependent release of PPD from PEG-PPD conjugates at different pH values. The error bar represent standard deviation (n=3).
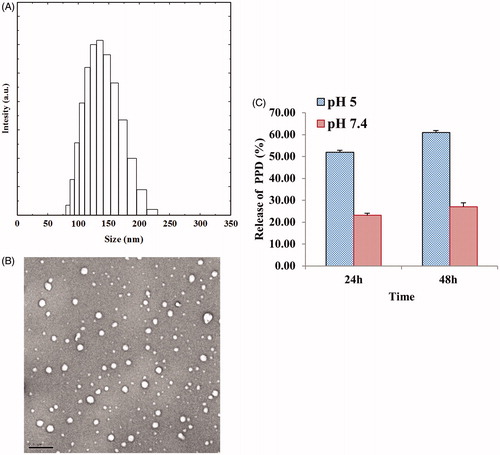
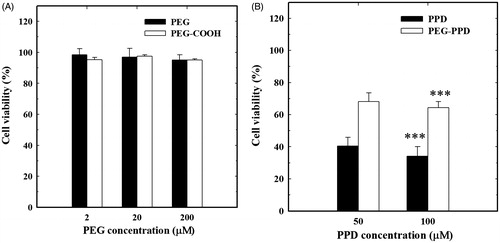
Figure 5. In vitro cytotoxicity of (A) PEG, PEG-COOH and (B) free PPD and PEG-PPD on HT-29 cancer cells. (A) Different concentration of PEG and PEG-COOH did not show any significant cytotoxicity in cancer cells. (B) PEG-PPD exhibited lower toxicity than free PPD, which may be due to slow release of PPD upon hydrolysis ester linkage. Error bars represent the standard deviation (n=3). ***p<0.001 versusss control (untreated group).