
Figures & data
Figure 1. Nanog and Oct4 mRNA expressions in RCC and paracancerous tissues detected by real-time fluorescent quantitative PCR (n=86).
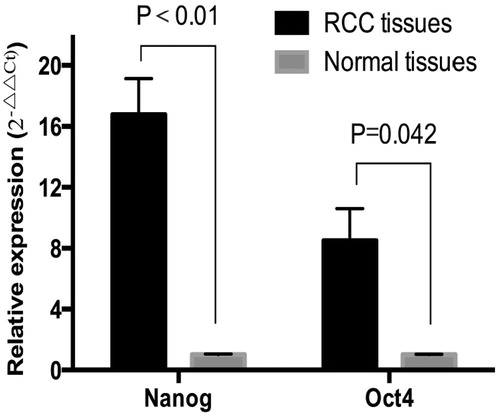
Table I. Correlations between Nanog and Oct4 expressions in RCC tissues and clinical pathological characteristics (n=86).
Figure 2. Nanog (A) and Oct4 (B) protein expressions in RCC and paracancerous tissues detected by immunofluorescent staining method.
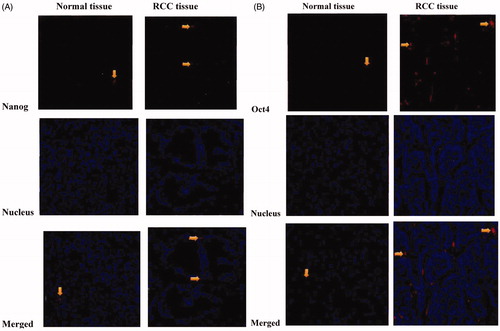
Figure 3. Overall metastasis-free survival curves of patients with positive Nanog (A) and Oct4 (B) protein expression and negative results.
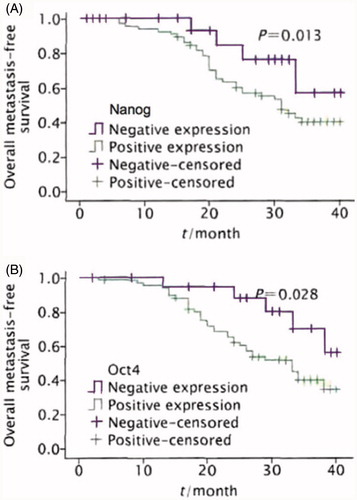
Table II. Univariate and multivariate analyses of prognostic factors.