Figures & data
Figure 1. Molecules of perflourohexyloctane (F6H8, a) and perfluorobutylpentane (F4H5, b) along with perfluoropentyloctane (F4H8, b). The largest resonance with an arbitrary chemical shift of 0 ppm in both 376.67 MHz–19F-spectra is affiliated to the CF3-group. The remaining resonances for F6H8 are at −32.7 ppm, −39.6 ppm, −40.5 ppm, −41.4 ppm and −44.1 ppm and belong to the CF2-components in the molecule. With less CF2-groups, F4H5 and F4H8 show identical spectra with resonances at 0 ppm, −32.7 ppm,−42.4 ppm and −44.1 ppm.
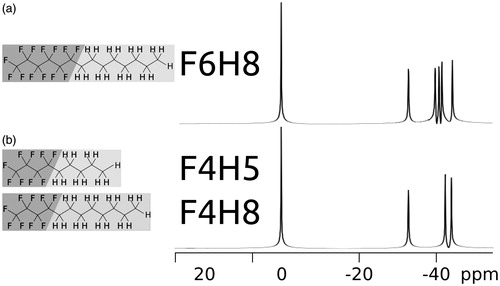
Figure 2. Linear regression of longitudinal relaxation rate R1 of F6H8, F4H8 and F4H5 versus oxygen partial pressure pO2 at physiological temperature (37 °C). Additionally, HFB and F6H8 at 20 °C.
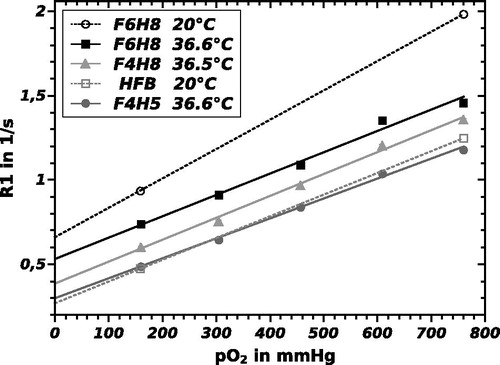
Figure 3. Linear relation of relaxation rate of F6H8 versus temperature at five O2 values.
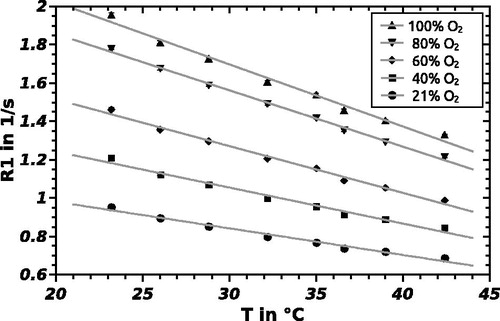
Table I. Comparison of temperature and pO2 coefficients for various fluorine compounds for the relation [mmHg].
Table II. Coefficients at physiological temperature (37 °C) for the relation R1[1/s] = A + B·pO2 [mmHg].
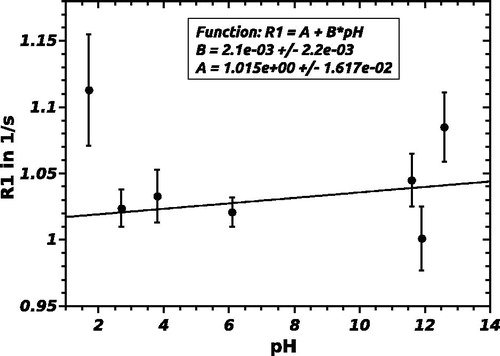
Figure 4. Dependence of longitudinal relaxation rate of pH at 20 °C and 21% pO2. The slope of the fit function is equal to 0 within the error margin, so R1 and pO2 do not correlate.