Figures & data
Table I. Composition of various microsphere batches.
Figure 1. FTIR spectra of: (a) Isoniazid, (b) lamivudine and (c) physical drug mixture (INH + LAM).
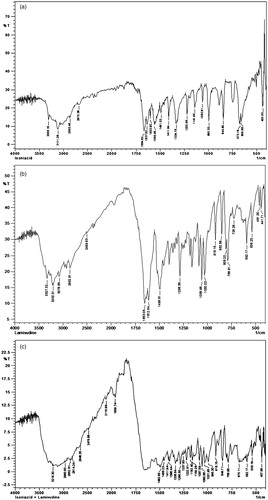
Figure 2. FTIR spectra of: (a) Ethyl cellulose, (b) Eudragit RS, (c) physical mixture of both drugs and polymers (INH + LAM + EC + EU) and (d) microspheres.
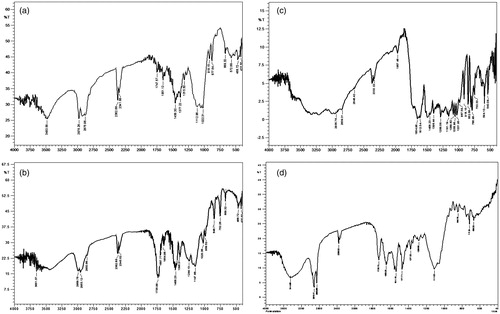
Figure 3. DSC thermogram of: (a) Lamivudine, (b) isoniazid, (c) Eudragit RS, (d) ethyl cellulose and (e) combined microspheres.
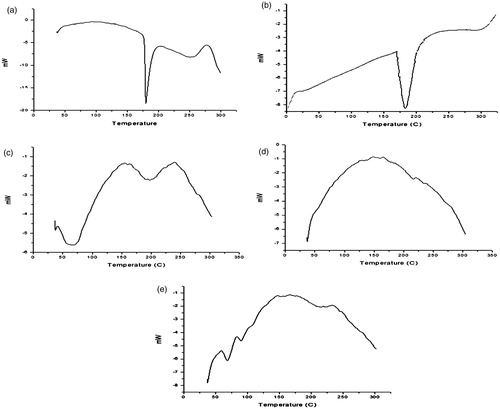
Figure 4. (a) Digital microscopic images of microspheres of optimized batch. (b) Digital microscopic images of co-loaded microspheres.
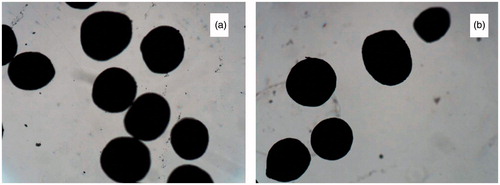
Figure 5. SEM images of: (a) EC microspheres, (b) EU microspheres, (c) combined microspheres at 200 × magnified surface of combined microspheres at (d) 500 × (e) 1000 × and (f) 5000×.
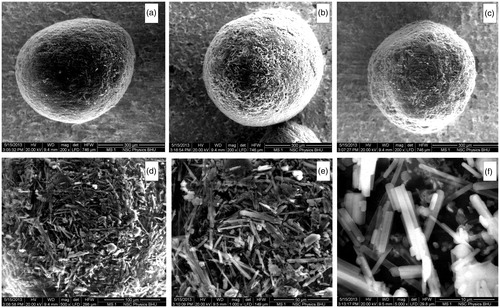
Table II. Particle size and yield of different batches of LAM and INH microspheres (n = 3).
Figure 6. Bar graph representation of entrapment efficiency and loose surface crystal. Values are expressed in percentage. Vertical bars represent average value ± standard deviation.
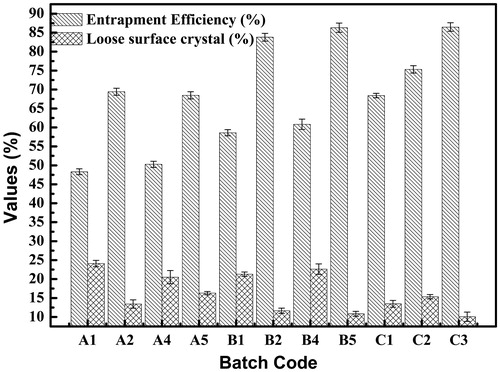
Figure 7. The cumulative percent of drug release from microspheres in phosphate buffer pH 7.4: (a) EC microspheres, (b) EU microspheres, and (c) combined microspheres.
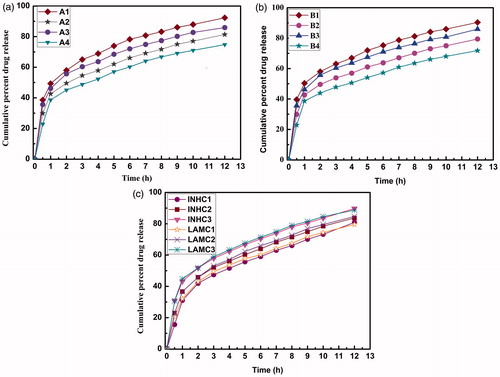
Table III. Kinetic analysis of in vitro release data.
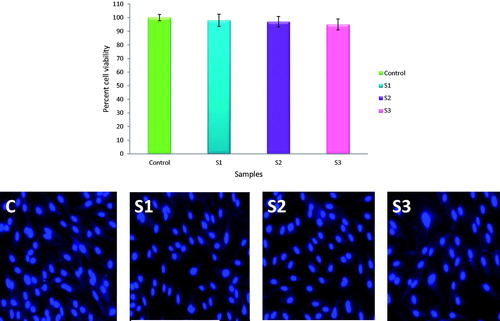
Figure 8. The percent cell viability of Caco-2 cells and DAPI-stained cells. S1, sample after 6 h; S2, sample after 12 h; S3, sample after 24 h.