Figures & data
Figure 1. Bio-characteristics of mouse RSCs. (A) Morphology of mouse RSCs. (B) Proliferation potential of RSCs under the cultural conditions in vitro. RSCs proliferation was analyzed by Ki67 staining, Ki67 is a nuclear non-histone protein and preferentially expressed during late G1, S, G2, and M phase of the cell cycle; while resting, non-cycling cells (G0 phase) lack Ki67 expression. RSCs from mouse were passaged 16 times and maintained in culture for 90 days with no sign of senescence or differentiation. (C) Special gene characteristics of mouse RSCs, immunoflourescence staining results showed that mouse RSCs were positive for the Nestin (scan bar = 50 μm).
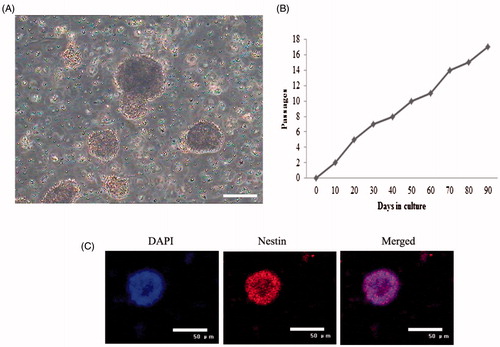
Figure 2. The function research of miRNA-9 in mouse RSCs. (A) The precursor of mmu-miR-9. (B) Diagram of recombinant lentiviral vector for pre-miR-9. (C) PTBP1 is the direct target of miR-9. miR-9 complementary sites with 3′UTR of PTBP1. The mutant sequence (PTBP1-MUT) is identical to PTBP1-WT construct except for five-point mutations disrupting base-pairing at the 5′end of miR-9 (indicated with a bar). Mutating the miR-9 target site in the 3′UTR of PTBP1 abolishes inhibition of luciferase activity by endogenous miR-9 in 293 cells. (D) RSCs were transfected with lentivirus as described in the “Methods” section, and the expression of miR-9 was quantified by real-time PCR. The expression of miR-9 was significant increase after transfection. (E) Effect of miR-9 on protein level of PBTP1 and PTBP2. (F and G) The protein expression level of PBTP1 and PTBP2 was analyzed by Image J tools.
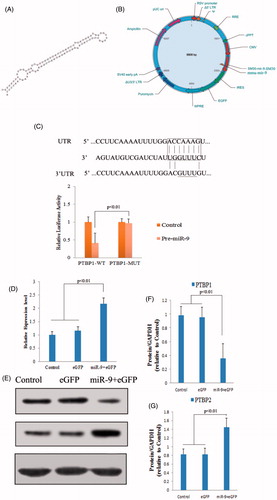
Figure 3. Neurogenic differentiation of mouse RSCs. (A) Immunoflourescence staining assay indicated that the neurogenic specific genes including NSE and GFAP were positive after induction of miR-9-expressed RSCs. NSE, special marker for nerve cell, GFAP, special marker of neurogliocyte (scan bar = 50 μm). (B) The percentage of NSE expression of neuron cells from RSCs and miR-9-expressed RSCs. (C) The percentage of GFAP expression of neuron cells from RSCs and miR-9-expressed RSCs. (D and E) Gene expression of NSE and GFAP detected in differentiated RSCs. Gene expressions in each group were determined by real-time PCR and then normalized to that of control (normal induction). Data are shown as means ± SEM from three repeated (*P < 0.05, **P < 0.01).
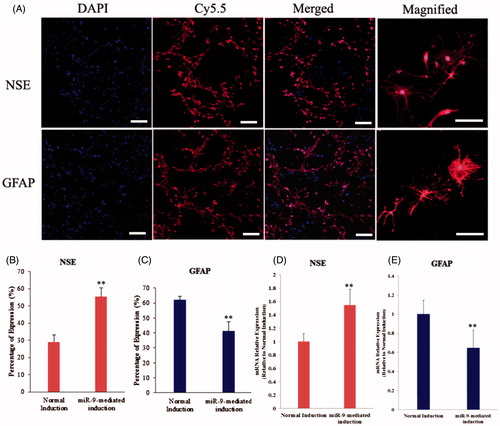
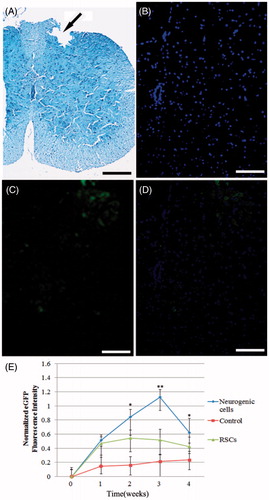
Figure 4. Transplantation of mice RSCs, RSCs-derived neuron cells resulted in cell survival, limited redistribution from site of implantation. (A) Spinal cord contusion injury resulted in a loss of tissue structure within the central region of the spinal cord by 2 week post-injury. Injury region were marked using black arrow, the pathological tissue was formed after injury, and dropped out when tissue sliced. (B–D) Cell track showing transplanted cells (eGFP) located primarily within the region of the spinal cord injury (scan bar = 100 μm). (E) Optical density analysis showed a greater number of RSCs, RSCs-derived neuron cells in the spinal tissue of mice in both cell treatment group and control group. The higher survival of RSCs and RSCs-derived neuron cells transplantation was maintained 4 weeks, 0 week as a control (*P < 0.05, **P < 0.01).