Figures & data
Figure 1. Characterization of Cur NPs. Cur NPs were observed under SEM (Panels A and B) and AFM imaging (Panel C).
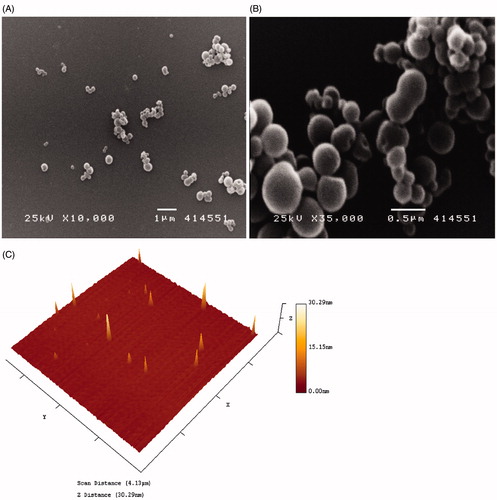
Table 1. Body and organ weight for control, MCT only and MCT + Cur NP rats collected 4 weeks after injection of MCT (60 mg/kg).
Figure 2. Cur NP treatment improves MCT-induced decrease in pulmonary artery flow. Representative image from a MCT only animal at day 1 (Panel A) and at day 28 (Panel B). Note mid-systolic notch at day 28. Images from a MCT + Cur NP treated animal at day 1 (Panel C) and at day 28 (Panel D).
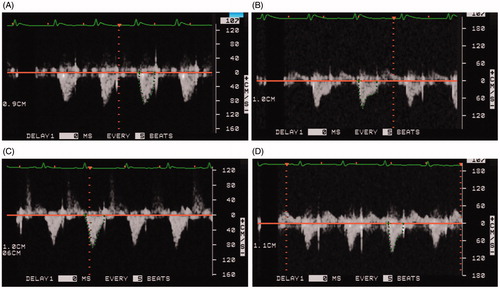
Figure 3. Cur NP treatment attenuates PAH induced increase in RV anterior free wall thickness. M-mode echocardiography images of a MCT only animal at day 1 (Panel A) and at day 28 (Panel B). Images from a MCT + Cur NP treated animal at day 1 (Panel C) and at day 28 (Panel D). Quantification of RV AVFW echocardiography (Panel E). Values are expressed as mean ± SEM; n = 6 for each group. *P < 0.05 versus base line of MCT only group.
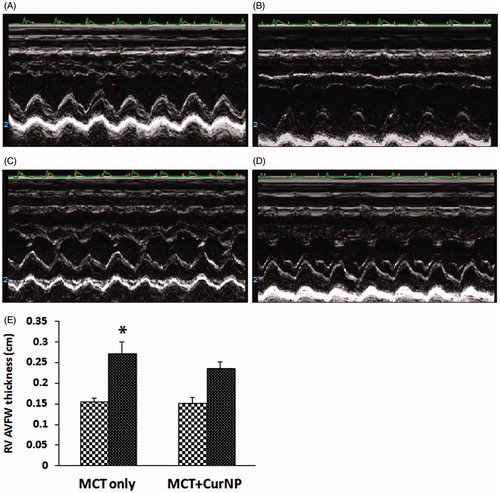
Figure 4. Cur NP treatment decrease PAH-induced cardiac remodeling. Myosin heavy chain-β protein expression in the RV as determined by immunoblotting and normalized to GAPDH (Panel A). Fibronectin protein expression normalized to GAPDH (Panel B). Graphical data are expressed as mean ± SEM; n = 6 for each group. *P < 0.05 versus control group; †P < 0.05 versus MCT + Cur NP group.
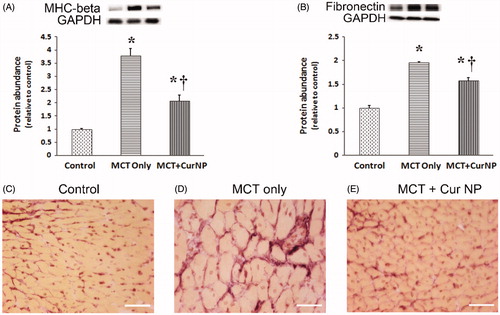
Figure 5. Cur NP treatment diminished MCT-induced increase in inflammatory cytokines. RV mRNA expression levels of TNF-α (Panel A) and IL-1β (Panel B). Values are expressed as mean ± SEM; n = 5 for each group. *P < 0.05 versus control group; †P < 0.05 versus MCT + Cur NP group.
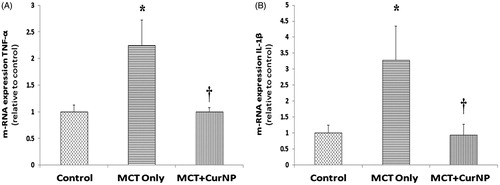
Figure 6. Cur NP treatment attenuates PAH-associated increase in heat shock protein and protein nitrosylation. The expression of Hsp-27 (Panel A), Hsp-70 (Panel B) and nitrotyrosine (Panel C) was determined by immunoblotting and normalized to the expression of GAPDH. Values are expressed as mean ± SEM; n = 6 for each group. *P < 0.05 versus control group; †P < 0.05 versus MCT + Cur NP group.
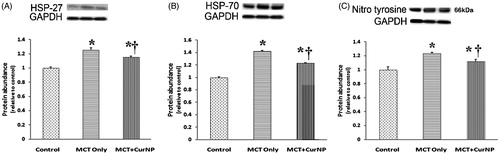
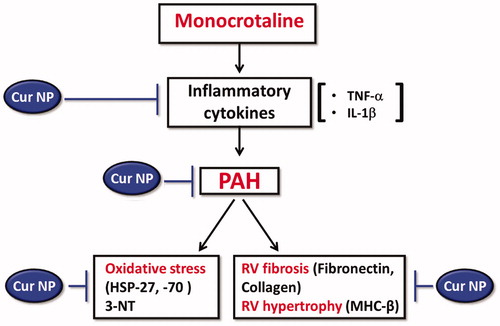
Figure 7. Schematic representation of proposed mechanism of action of Cur NP against MCT-induced cardiac remodeling.