Figures & data
Table 1. AWR scores at different pressures (point, x ± s).
Figure 1. Locations of NLRP3 (A), ASC (B) and caspase-1 (C) in the mucous layer of ileal tissues; nuclei (blue), cytoplasm (green).
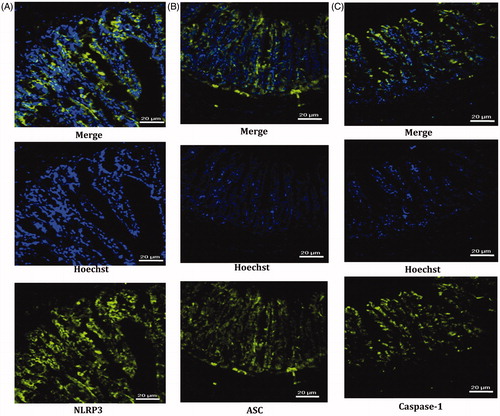
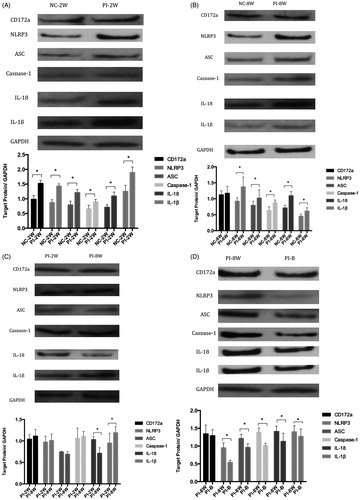
Figure 2. Expressions of NLRP3 inflammasome and related proteins. (A) Comparisons between PI-2W and NC-2W groups; (B) comparisons between PI-8W and NC-8W groups; (C) comparisons between PI-2W and PI-8W groups; (D) comparisons between PI-8W and PI-B groups. *P < 0.05. n = 10, each experiment was performed in triplicate, and the mean was used.