Figures & data
Figure 1. UV–VIS spectra of time dependent synthesis of gold nanoparticles (a) and silver nanoparticles (b), respectively.
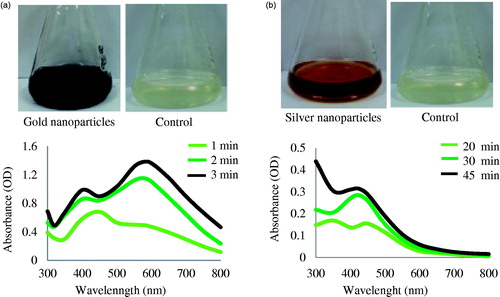
Figure 2. FE-TEM image of gold nanoparticles, 10 nm (a) and 20 nm (b). Fringe spacing of gold nanoparticles (c) and the corresponding SEAD image (d). Elemental mapping results indicate TEM micrograph of gold nanoparticles pellet solution (e) and gold nanoparticles; green, (f) respectively.
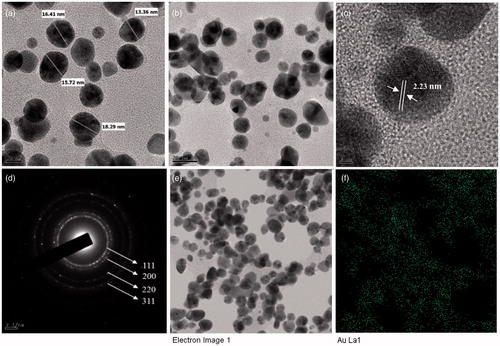
Figure 3. FE-TEM image of silver nanoparticles, 10 nm (a) and 20 nm (b). Fringe spacing of silver nanoparticles (c) and the corresponding SEAD image (d). TEM micrograph of silver nanoparticles pellet solution (e) and silver nanoparticles; green, (f), respectively.
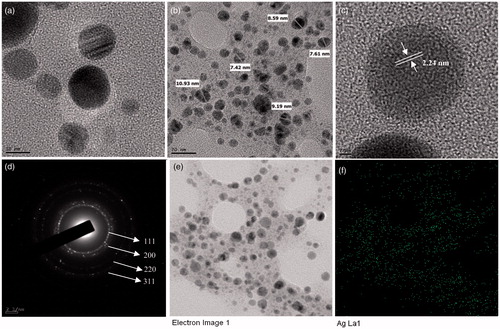
Figure 4. EDX spectrums of gold nanoparticles (a) and silver nanoparticles (b). XRD pattern of gold (c) and silver (d) nanoparticles, correspondingly.
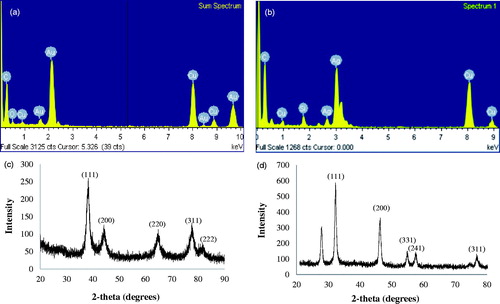
Figure 5. Particles size distribution according to number, volume and intensity, gold nanoparticles (a) and silver nanoparticles (b) respectively.
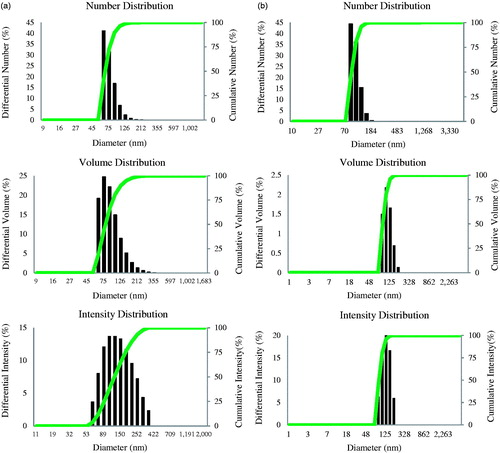
Table 1. Antimicrobial activity of silver and gold nanoparticles against E. coli, S. enterica, V. Parahaemolyticus, S. aureus. B. anthracis and B. cereus.
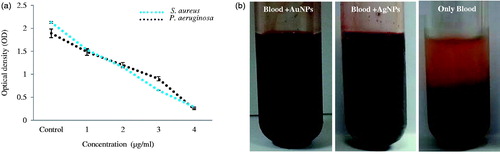
Figure 6. Biofilm inhibition results of silver nanoparticles against S. aureus and P. aeruginosa (a), Anticoagulant effect of silver and gold nanoparticles (b).