Figures & data
Figure 1. The schema chart of the animal model (TACE).
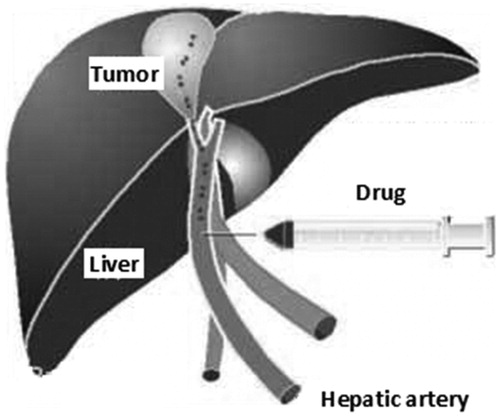
Table I. Grouping and dosage (n = 16).
Figure 2. Scanning electron microscope photograph of ZTO-loaded chitosan microspheres: ×3000.
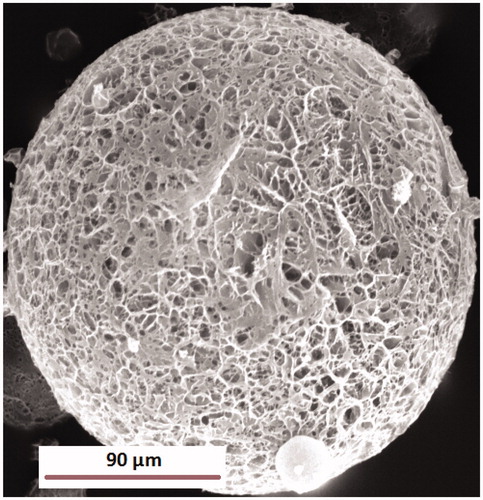
Figure 3. Changes of tumor volume in rats transplanted with hepatocellular carcinoma cells line walker-256 on seventh day (n = 8) *p < 0.05 the tumor volume before and after treatment.
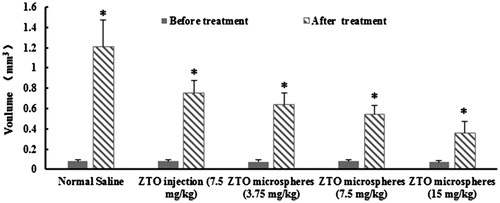
Table II. The effect of ZTO-loaded chitosan microspheres and ZTO injection on rats of walker-256 cells (n = 8).
Figure 4. The survival time of the rats transplanted with hepatocellular carcinoma cells line walker-256 on seventh day after arterial infusion (n = 8).
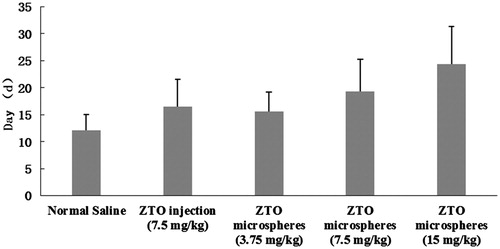
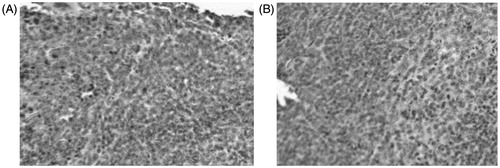
Figure 5. Histopathological studies of liver. (A), control group; (B) ZTO-loaded chitosan microspheres.