Figures & data
Figure 1. (A) FTIR spectra of PLGA-PEG, (B) FTIR result shows the presence of chrysin in PLGA-PEG nanoparticle.
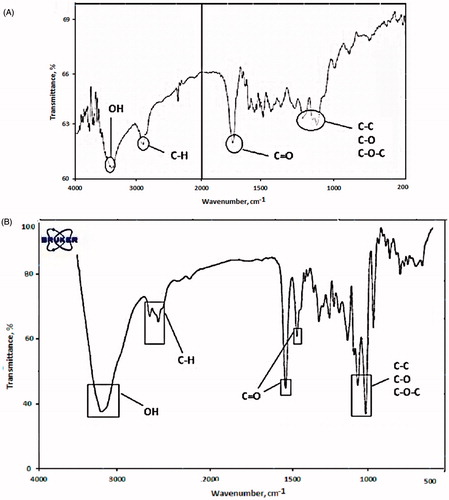
Figure 2. The1H-NMR spectrum of PLGA-PEG.
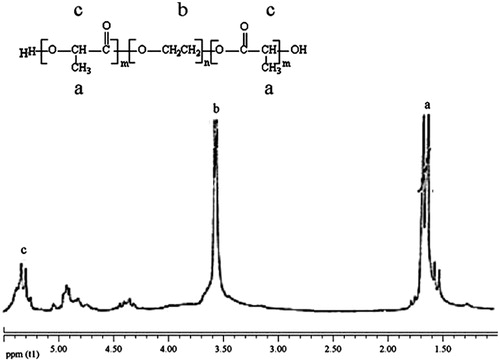
Figure 3. (A) The micrographs of PLGA-PEG copolymers and (B) the micrographs of PLGA-PEG-loaded chrysin.
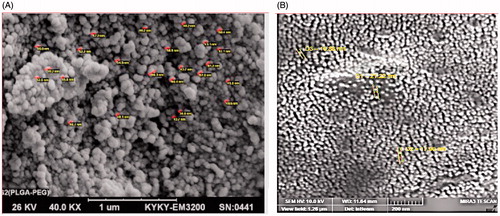
Table 1. IC50 value of pure and nano chrysin.
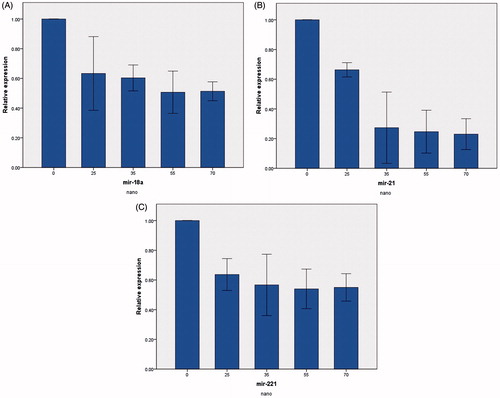
Figure 4. Real-time PCR results of miRNAs when treatment with pure chrysin. Real-time PCR results showed that relative expression of (A) miR-18a, (B) miR-21, and (C) miR-221 was decreased by pure chrysin.
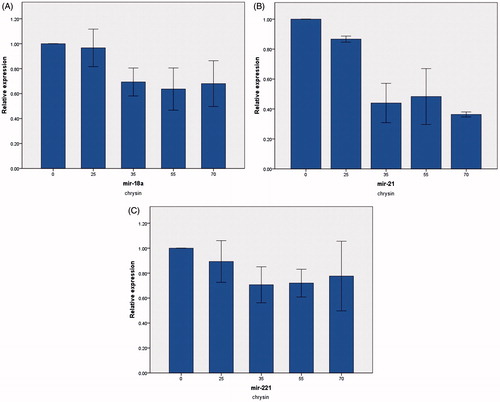
Figure 5. Real-Time PCR results of miRNAs when treatment with nanochrysin. (A) Real-time PCR results showed that relative expression of (A) miR-18a, (B) miR-21, and (C) miR-221 was decreased by nanochrysin.