
Figures & data
Figure 1. Effect of (A) liquid/solid lipid ratio, (B) drug concentration on formulation parameters: particle size, polydispersity index (PDI), zeta potential (ZP). Data are expressed as mean ± SD (n = 3).
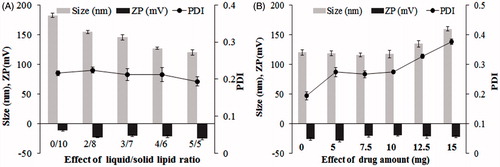
Table 1. Composition of Artesunate-loaded nanostructured lipid carriers.
Table 2. Drug entrapment efficiency and loading capacity of Artesunate-loaded nanostructured lipid carriers.
Figure 2. TEM image of ART-NLC.
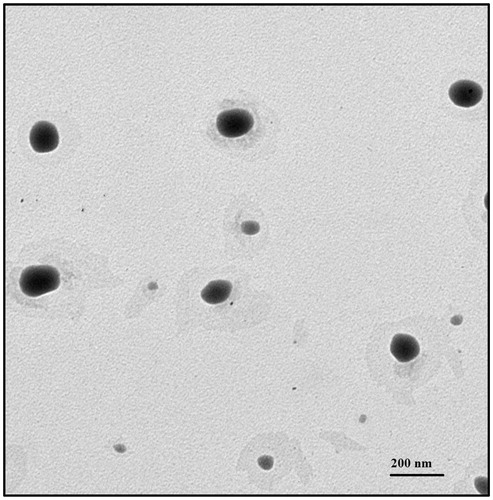
Figure 3. (A) Differential scanning calorimetry, (B) X-ray diffraction patterns of Compritol, free ART, blank NLC, and ART-NLC.
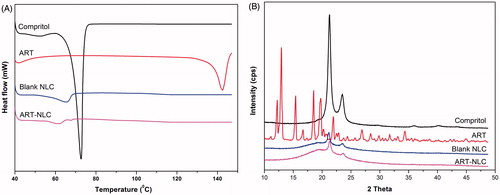
Figure 4. In vitro drug release (data are expressed as mean ± SD, n = 3).
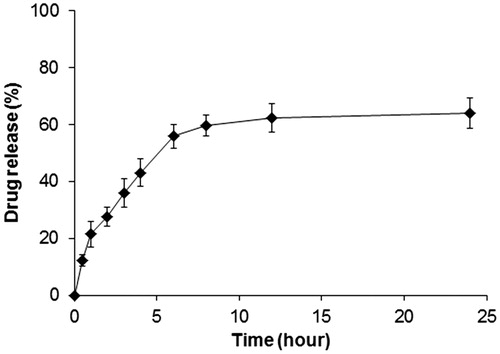
Table 3. Summary of residual standard errors and AIC of drug release models.
Figure 5. Quantitative uptake of analysis by flow cytometry of NLC on: (A) MCF-7 cells, and (B) MDA-MB-231 cells. Control (orange), treated NLC (blue).
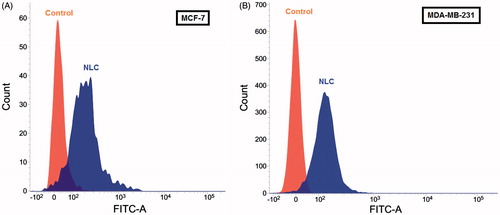
Figure 6. Intracellular uptake of NLC into MCF-7 cells and MDA-MB-231 cells by confocal laser scan microscope images. NLC containing NBD-PC (green) and Lysotracker Red (red) staining lysosome were used for this experiment.
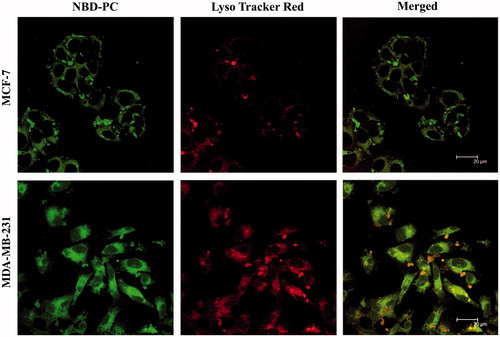
Figure 7. In vitro cytotoxicity of blank NLCs, free ART, and ART-NLCs after 24 and 48 h exposure in MCF-7 and MDA-MB-231cells (P < 0.05). Data are expressed as mean ± SD (n = 8). *P <0.05, compared to the free drug.
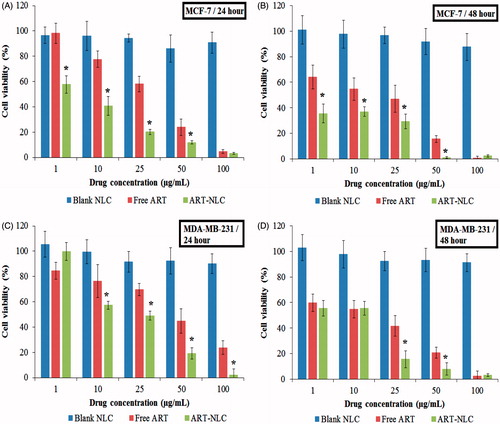
Figure 8. Nucleus apoptosis assay after 24 h treatment at the ART concentration of 10 μg/mL on MCF-7 and MDA-MB-231cells by confocal laser scan microscope images.
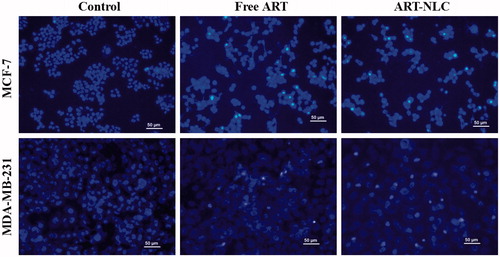
Figure 9. Physical properties of ART-NLCs after 30 d storage in different conditions. Data are expressed as mean ± SD (n = 3).
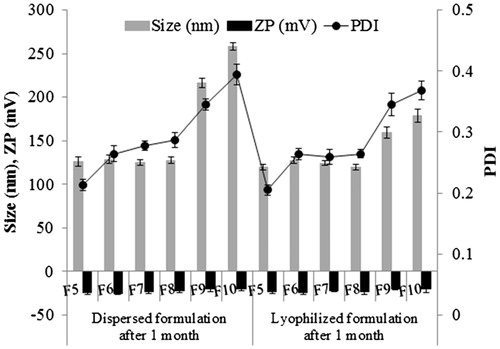
Table 4. Drug entrapment efficiency (EE) and loading capacity (LC) of Artesunate-loaded nanostructured lipid carriers after 30 d storage.