Figures & data
Figure 1. Tumor mass regression in group treated with IL-12. The results showed that the tumor mass volume was significantly reduced in group treated with IL-12 (P = 0.000).
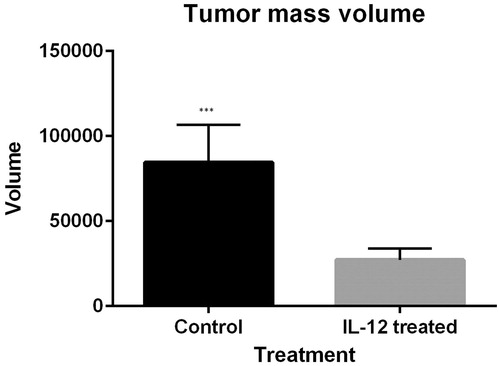
Figure 2. (A) Relative expression of IL-12. IL-12 gene expression in the group treated with IL-12 is UP-regulated (compared to the control group) by a mean factor of 1.9 (P = 0.000; standard error range is 1.90–1.90). (B) Relative expression of IFN-γ. IFN-γ gene expression in the group treated with IL-12 is up-regulated (compared to the control group) by a mean factor of 1.76 (P = 0.00; SE range is 1.76–1.76).
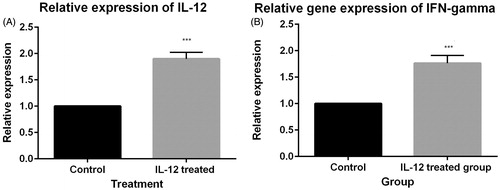
Figure 3. The cytokine expression results of western blot: IL-12 and IFN-γ expression has been proved by western blotting analysis. One sample of each group has been showed in picture. (A) expression of β-actin. (A) Proteins were equalized by use of β-actin expression. (B) expression of IL-12. (B) Western blotting results showed that IL-12 expression was enhanced in group treated with IL-12 incomparable to control group. (C) expression of IFN-γ. (C): Western blotting results showed that IFN-γ expression was enhanced in group treated with IFN-γ incomparable to control group.
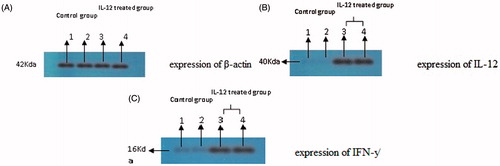
Table 1. Expression of IL-12 and IFN-γ in tumors.
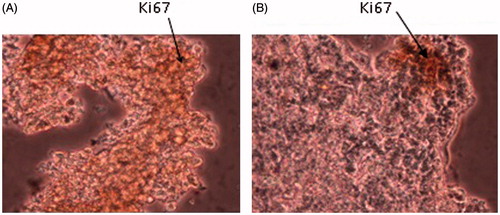
Figure 4. Expression of Ki67 in tumor tissues. (A) Expression of Ki67 in control group. (B) Expression of Ki67 in IL-12 treated group. Expression of Ki67 was reduced in IL-12 treated group incomparable to control group.