Figures & data
Figure 1. Synthesis of hydrophobically modified Bletilla striata polysaccharides with different fatty acids (m: the amount of carbon).
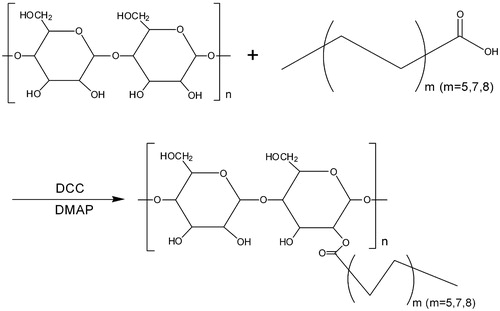
Figure 2. FT-IR spectra of BSP and its derivatives (a: BSP, b: hm-BSP-C12, c: hm-BSP-C16, d: hm-BSP-C18).
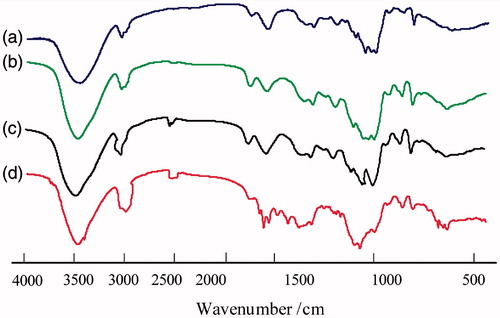
Figure 3. The 1H NMR spectra of BSP and its derivatives (a: BSP, b: hm-BSP-C12, c: hm-BSP-C16, d: hm-BSP-C18) in deuterated DMSO.
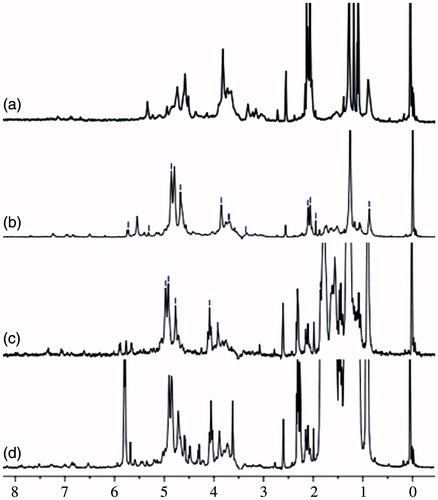
Table 1. Properties of hm-BSPs.
Figure 4. Change of the intensity ratio (I373/I390) from emission spectra of pyrene (6.0 × 10⁻⁷) with various concentrations of hm-BSPs in distilled water.
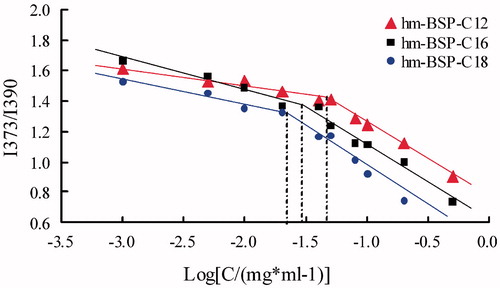
Figure 5. Appearance for BSP and hm-BSP solutions (a: hm-BSP-C12, b: hm-BSP-C16, c: hm-BSP-C18, d: BSP).
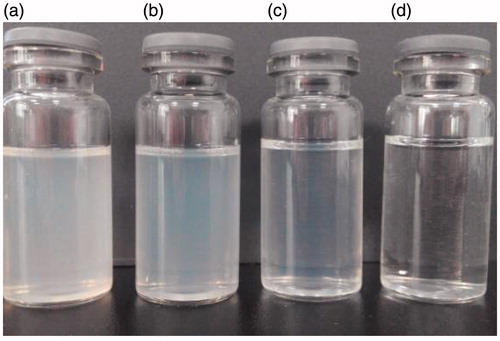
Figure 6. Particle size distribution (a) and TEM photograph of hm-BSP-C18 nanoparticles (b).
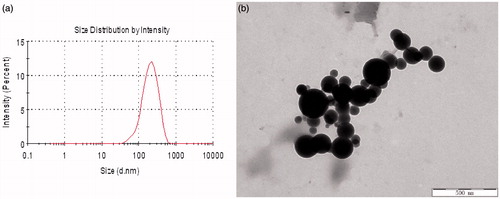
Figure 7. Visual observation of hemolysis caused by hm-BSP-C18 at preset time intervals with different concentrations (mg/mL): (a) 0.2, (b) 0.4, (c) 0.6, (d) 0.8, (e) 1.0, (f) 1.5, (g) 2.0, (h) 4.0, (i) normal saline (negative control), and (j) distilled water (positive control).
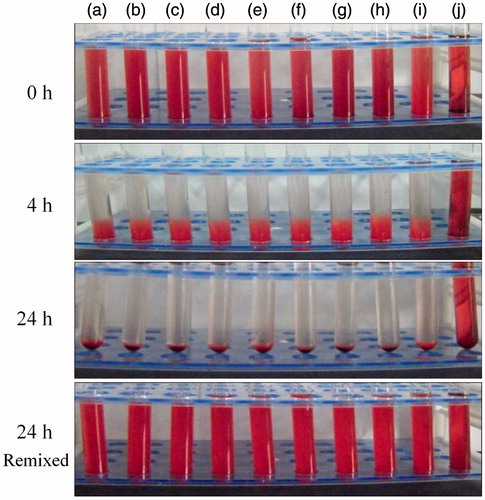
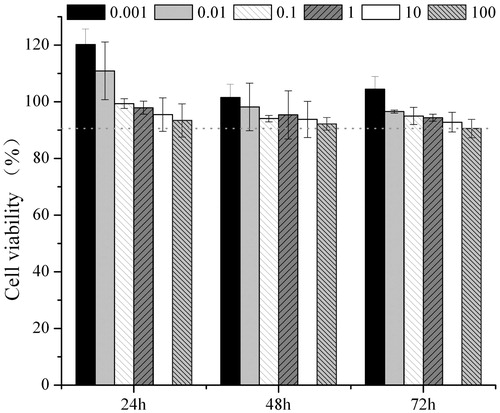
Figure 8. Cytotoxicity of hm-BSP-C18 at different concentrations against HepG2 cells for 24, 48, and 72 h. Results were shown as mean ± SD (n = 6).