Figures & data
Figure 1. Chemical structures of TNBS and gelatin reaction.
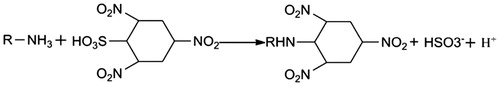
Figure 2. Scheme of ASA/AG hydrogel preparation by mixing ASA solution and AG solution via double mix syringe glue applicator, with the cross-linking mechanism of Schiff’s base reaction.
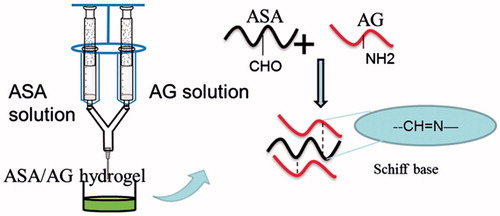
Figure 3. Schematic of measuring the bonding strength at room temperature. (a) Two porcine skin were overlapped with a bonding area 1 × 1 cm2 and loaded 50 g. (b) The bonding strength was measured in the tension mode.
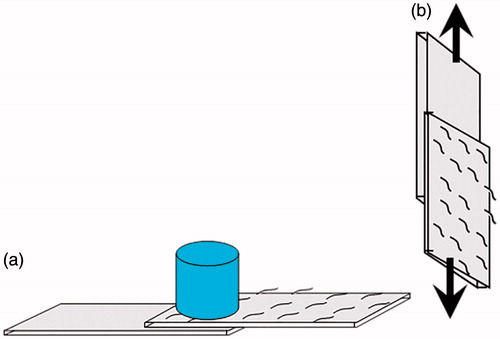
Table 1. The relationship of dissolved temperature, dissolved time, and viscosity.
Figure 4. The reaction schemes of sodium alginate to aldehyde sodium alginate.
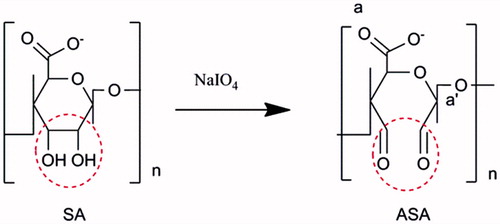
Figure 5. The influence of reaction time on the oxidized degree of ASA, with the molar ratio of oxidizer (NaIO4)/SA repeat unit is 1.
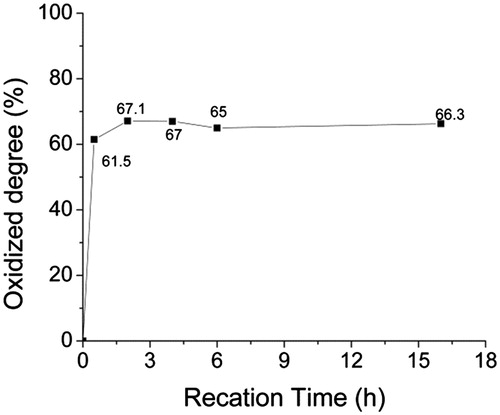
Table 2. The OD of ASA with different molar ratios of oxidizer (NaIO4) to SA unit.
Figure 6. The synthesis route of amino gelatin (AG), by changing carboxyl groups into amino groups.
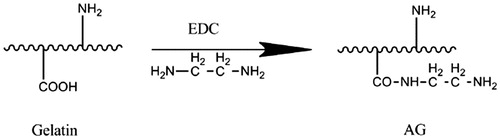
Table 3. The amount of amino group in AG measured by TNBS assay, after the change of carboxyl groups in primary AG into amino groups with different molar ratios of ED/COOH.
Figure 7. The sol-gel temperature of 40% (w/v) AG with different amount of amino groups.
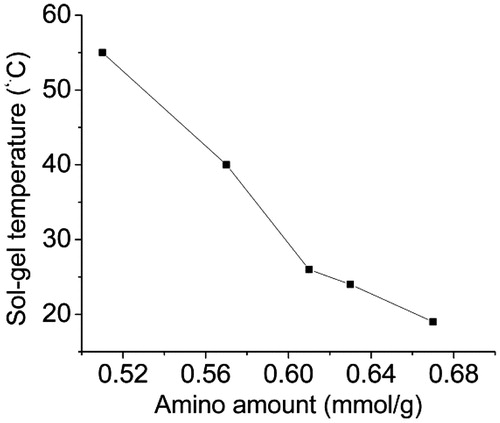
Figure 8. ATR-FTIR spectra of ASA (a), AG (b), and ASA/AG hydrogels (c).
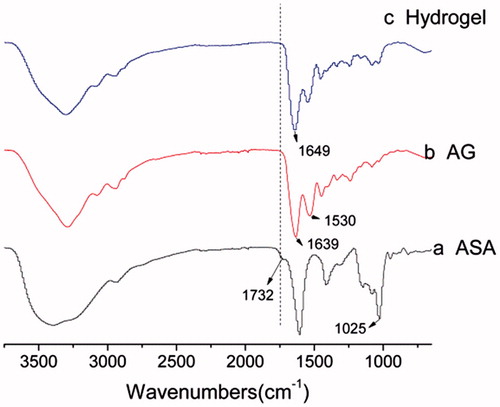
Figure 9. The bonding strength of porcine skin adhered by mixing solution of 40 wt% ASA-1 (OD is 23%) and 40% (w/v) AG with different amount of the amino groups.
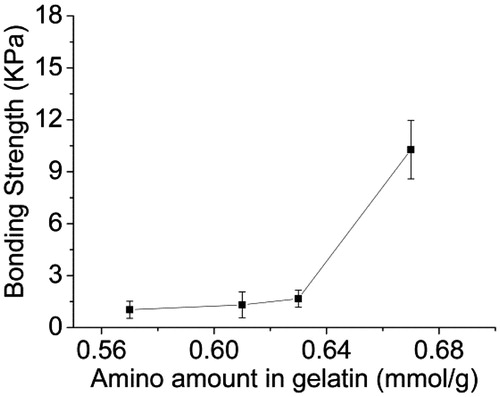
Figure 10. The bonding strength of porcine skin adhered by mixing solution of 40% (w/v) ASA with different OD and 40% (w/v) AG-2.
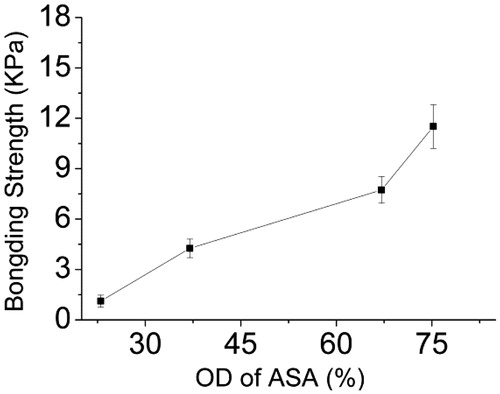
Figure 11. The bonding strength of porcine skin adhered by commercial fibrin glue, 40% (w/v) ASA-4 and mixing solution of 40% (w/v) ASA-4 with 40% (w/v) AG-2.
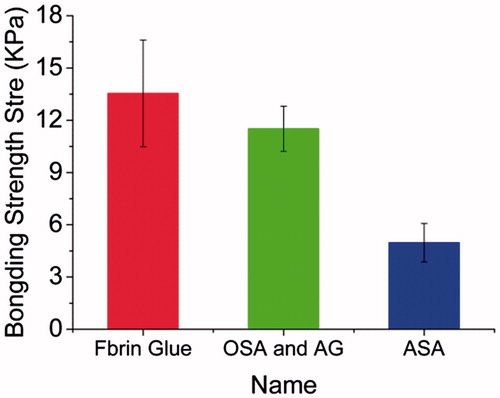
Figure 12. (a) The gelling time with 40 wt% ASA solutions mixed with 40 wt% AG-4 solutions. (b) The gelling time dependence on 40 wt% AG solutions mixed with 40 wt% ASA-4 solutions.
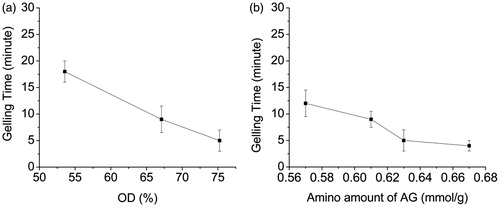
Figure 13. (a) Influence of the OD of ASA on ASA/AG-4 hydrogel swelling. (b) Influence of amino amount of AG on ASA-3/AG hydrogel swelling ratio.
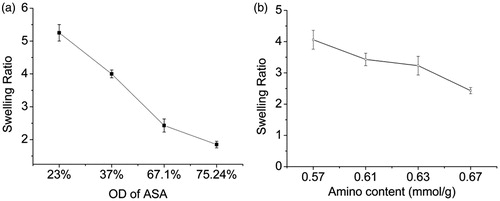
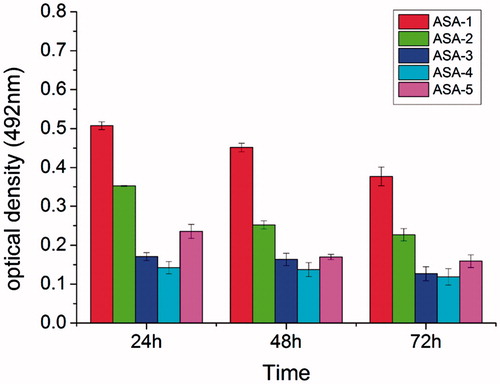
Figure 14. The results of MTT assay for hydrogels extraction solution.