Figures & data
Table I. Chemical composition of pumice.
Figure 1. SEM images of different cryogel structures. (A, B) Comparative representation of cryogels with and without pumice particles, respectively. (C, D) The cryogel walls built by micro pumice particles.
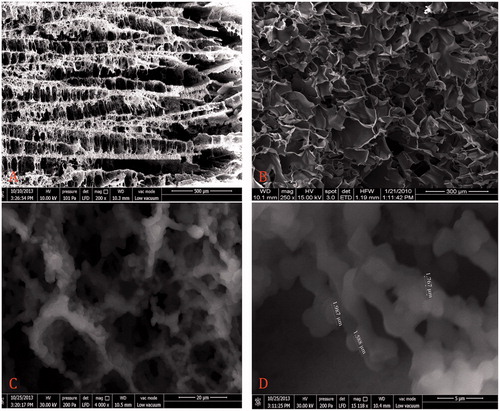
Figure 2. Effect of pH on adsorption of HSA; embedded Cu2+-APPs: 15 mg; HSA concentration: 0.25 mg/ml; flow rate: 1 ml/min; T: 25 °C.
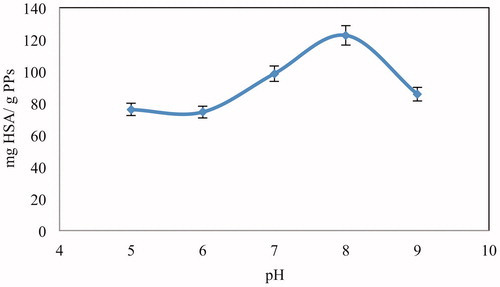
Figure 3. Effect of concentration of HSA on adsorption; pH: 8.0; embedded Cu2+-APPs: 15 mg; flow rate: 1 ml/min; T: 25 °C.
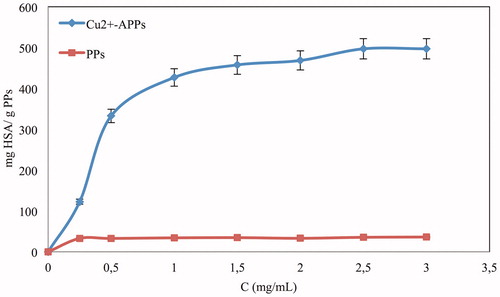
Table II. Comparison of adsorption capacities of some different adsorbents for HSA.
Figure 4. Effect of flow rate on adsorption of HSA; pH 8.0; concentration of HSA: 0.25 mg/ml; embedded Cu2+-APPs: 15 mg; T: 25 °C.
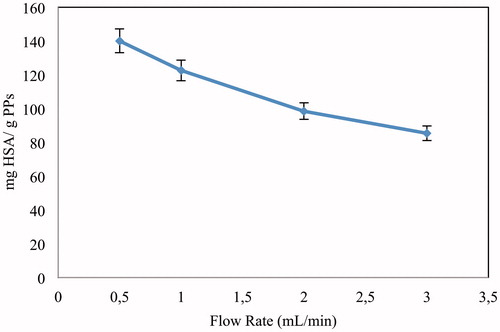
Figure 5. Effect of ionic strength on adsorption of HSA; pH 8.0; concentration of HSA: 0.25 mg/ml; embedded Cu2+-APPs: 15 mg; T: 25 °C.
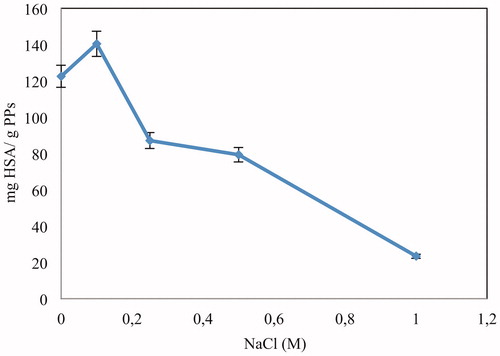
Figure 6. Effect of temperature on adsorption of HSA; pH 8.0; concentration of HSA: 0.25 mg/ml; embedded Cu2+-APPs: 15 mg; flow rate: 1 ml/min.
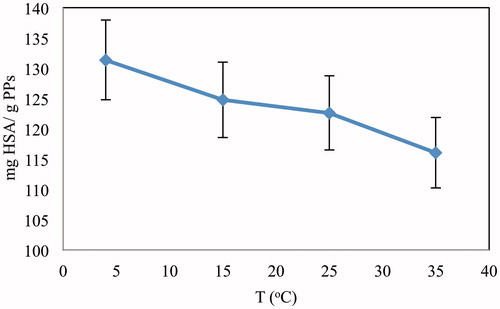
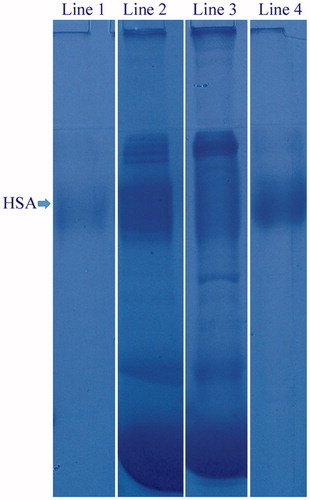
Figure 7. Plasma fractions at SDS/PAGE gel: lane 1 defines biomarker; lane 2 defines 1:10 diluted plasma before adsorption; lane 3 defines 1:10 diluted plasma after adsorption; lane 4 defines HSA desorbed. In each lane, there are equal amounts of samples.