
Figures & data
Figure 1. ESEM image of nanocurcumin after coated by platinum (Pt) using a 15 kV beam, magnification 60,000×, working distance 9.2 mm, scale bar 1 μm, particle size of nanocurcumin (34–359.4) nm.
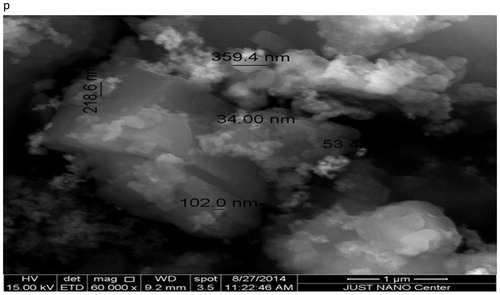
Table 1. IC50 values for the nanocurcumin and parent curcumin.
Figure 2. The cell viability for PC3 prostate cancer cell line after treatment by curcumin and nanocurcumin, after incubated overnight at 37 °C and 5% CO2. The Y axis indicates the cell viability at λ = 540 nm and the X axis corresponding to curcumin and nanocurcumin concentration. Data represent three independent experiments.
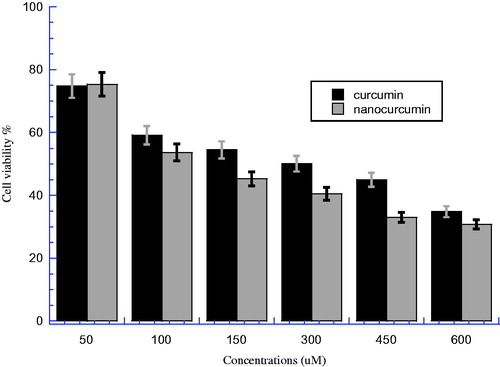
Figure 3. The cell viability for HEK cell line after treatment by curcumin and nanocurcumin, after incubated overnight at 37 °C and 5% CO2. The Y axis indicates the cell viability at λ = 540 nm and the X axis corresponding to curcumin and nanocurcumin concentration. Data represent three independent experiments.
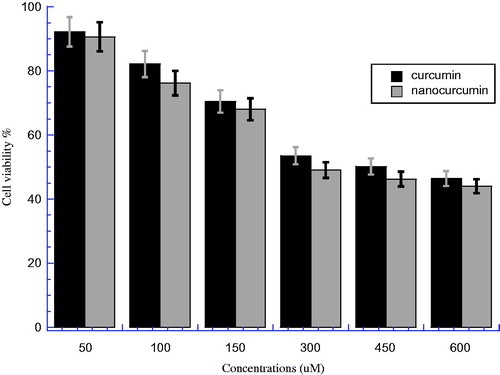
Figure 4. (A) The cell viability for HEK and PC3 cells line after treatment by curcumin, after incubated overnight at 37 °C and 5% CO2 (P < 0.05). (B) The cell viability for HEK and PC3 cells line after treatment by nanocurcumin, after incubated overnight at 37 °C and 5% CO2 (P < 0.05). The Y axis indicates the cell viability at λ = 540 nm and the X axis corresponding to curcumin and nanocurcumin concentration. Data represent three independent experiments.
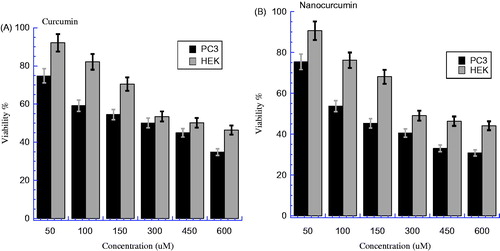
Figure 5. Nanocurcumin versus curcumin hemolysis %. Different concentrations of solutions (50, 100, 200, 400, and 600 μM) were incubated with 4% human erythrocytes suspension. Results were recorded at λ = 450 nm after 60 min incubation, P > 0.05 between two groups.
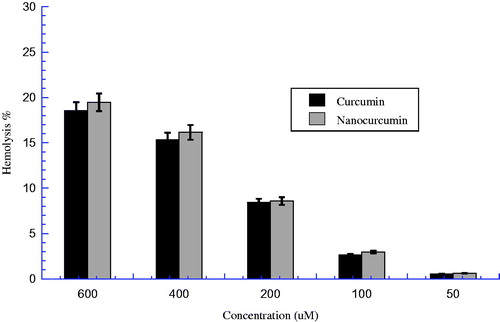
Table 2. The hemolytic effect for both curcumin and nanocurcumin and the efficiency % on human erythrocytes after incubated 60 min.
Figure 6. The bacterial growth curve for Escherichia coli, Micrococcus luteus, Pseudomonas aeruginosa, and Staphyloccus aureus after treatment by both nanocurcumin and parent curcumin at different concentrations then incubated overnight at 37 °C. The Y axis represents the inhibition % and the X axis corresponding to compounds concentrations. The results were repeated in triplicates with standard deviation range (0–1.85) for nanocurcumin and (0.14–1.63) for parent curcumin.
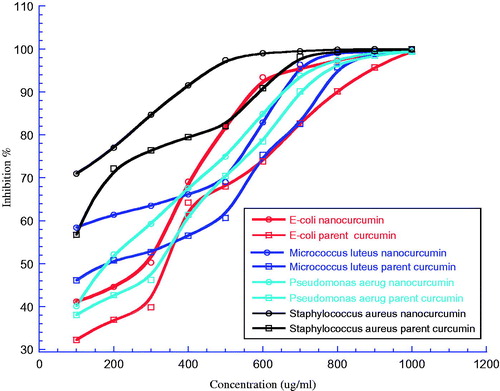
Table 3. Minimum inhibitory concentrations (MBCs) of both nanocurcumin and parent curcumin against the test microorganisms.