Figures & data
Table 1. Primer sequences for real-time PCR.
Figure 1. Fluorescence microscopic observation of C3H10T1/2 cells 48 h after infection (100×). (A): Ad-VEGF165 group; (B): Ad-BMP2 group; (C): Ad-VEGF165 + Ad-BMP2 group.
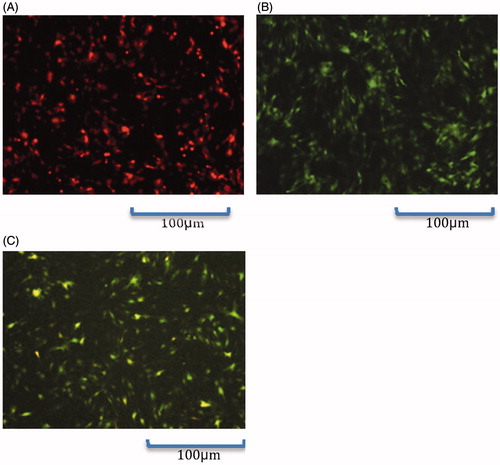
Figure 2. VEGF165 and BMP2 mRNA expression levels detected by real-time PCR (x±s, n = 3).
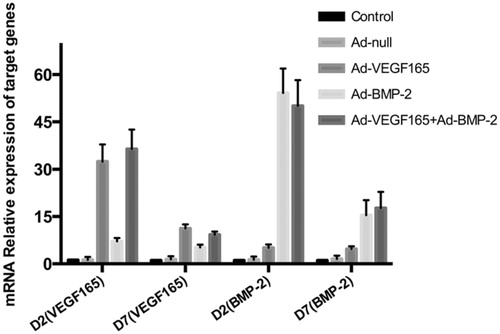
Table 2. VEGF165 and BMP2 mRNA expression levels detected by real-time PCR (x±s, n = 3).
Figure 3. Detection of osteogenic indices by Western blot. 1: Control group; 2: Ad-null group; 3: Ad-VEGF165 group; 4: Ad-BMP2 group; 5: Ad-VEGF165 + Ad-BMP2 group.
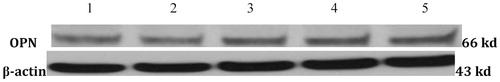
Table 3. OC, OPN, and OPG expression levels (x±s, n = 3).
Figure 4. ALP activities (x±s, n = 3). a: comparison between Ad-BMP2, Ad-VEGF165 + Ad-BMP2 groups and control, Ad-null and Ad-VEGF165 groups, P < 0.05; b: comparison between Ad-VEGF165 + Ad-BMP2 and Ad-BMP2 groups, P < 0.05.
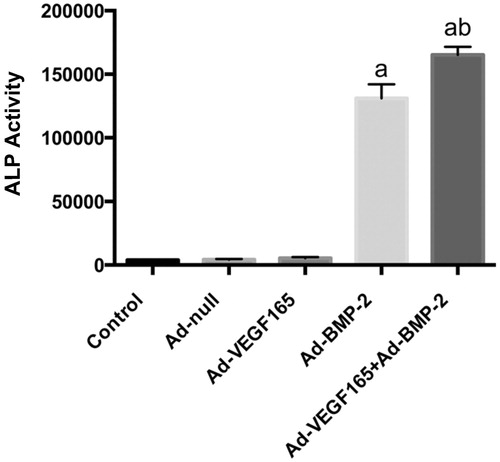
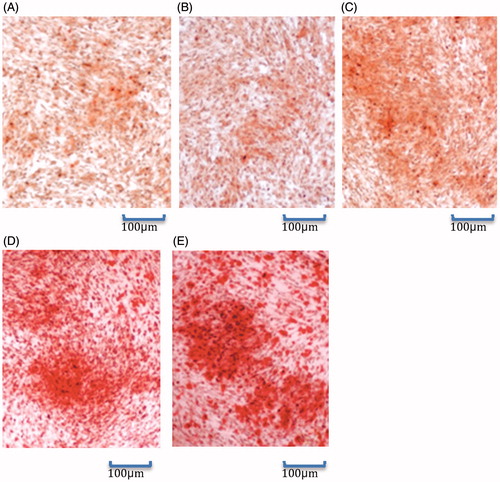
Figure 5. ALP staining results (100×). (A): Control group; (B): Ad-null group; (C): Ad-VEGF165 group; (D): Ad-BMP-2 group; (E): Ad-VEGF165 + Ad-BMP2 group.
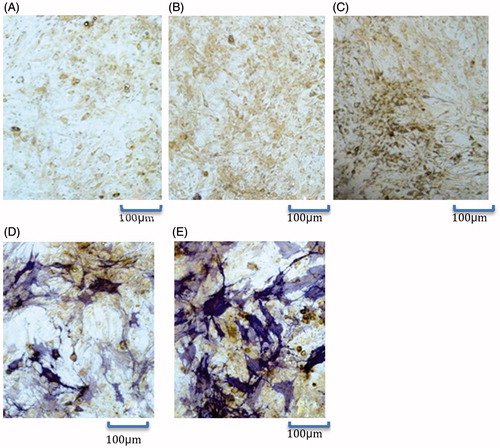
Table 4. ALP activities (x±s, n = 3).
Figure 6. Alizarin red staining results (100×). (A): Control group; (B): Ad-null group; (C): Ad-VEGF165 group; (D): Ad-BMP-2 group; (E): Ad-VEGF165 + Ad-BMP2 group.