Figures & data
Table 1. Primer sequences
Figure 1. Karyotype analysis of eyelid fat derived stem cells (EFDSCs) cultured on nanofibrous substrate. All stem cells at seven passages represented a normal 46XX karyotype.
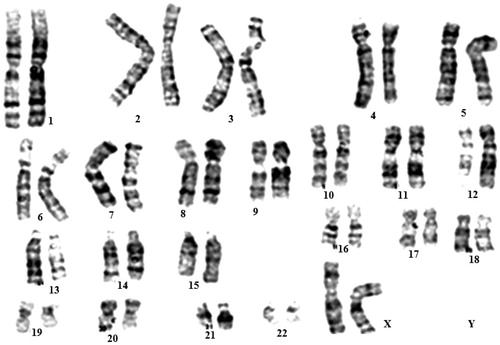
Figure 2. Flow cytometry analysis of eyelid fat derived stem cells (EFDSCs) for surface markers CD34, CD45, CD166, CD73, CD44, CD105, CD90, and CD31. The blue color indicates positives and red one indicates negatives.
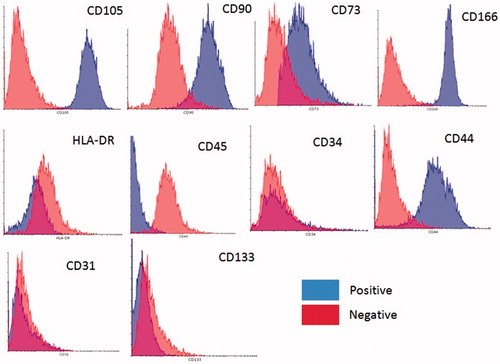
Figure 3. Human EFSCs after osteogenic and adipogenic differentiation in vitro. Control or undifferentiated EFSCs are not reddish, whereas the differentiated EFSCs derived osteoblast show vast extracellular calcium deposits, stained in Alizarin reds (A) and lipid droplets are visible in EFSCs adipogenic test culture (B) but not in control (C) after staining with Oil-Red-O indicating that EFSCs are undergoing adipogenic differentiation. (D) Transcription of the adipocyte-specific markers PPARγ2 and osteoblast specific markers; Osteocalsin, Osteopontin. Relative levels of mRNA expression are shown as means ± SEM of three independent experiments.
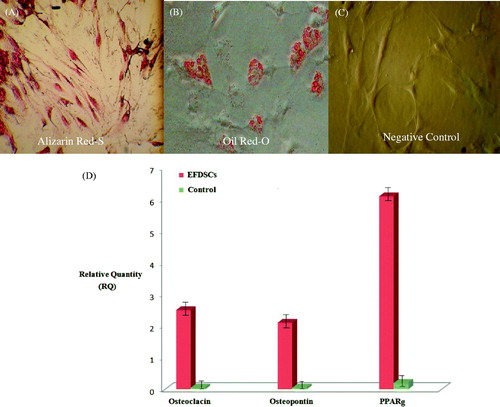
Figure 4. SEM images of designed mats: (A) non-oriented gelatin nanofibers and (B) oriented gelatin nanofibers. Cultured stem cells before induction airlifting on control (TCPS) surface (C); after induction airlifting on oriented gelatin nanofibrous mat (D); and on non-oriented mat (E); inverted microscopic images of cultured stem cells; before induction airlifting on control (TCPS) surface (F); culture on oriented gelatin nanofibrous mat (G); and non-oriented mat (H); after induction airlifting on oriented gelatin nanofibrous mat (I); and on non-oriented (J).
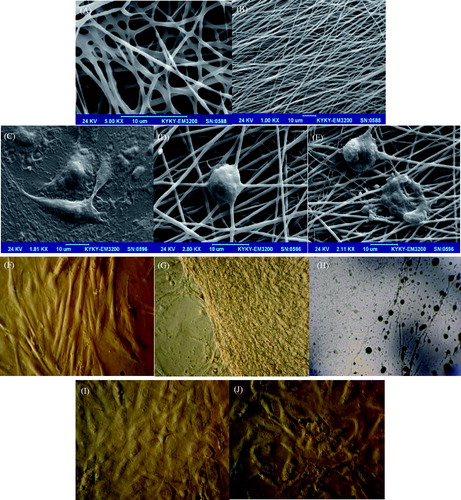
Figure 5. The live/dead assay result for rate of proliferation of EFSCs on nanofibrous mats at 24, 48 and 72 h continuous culture.
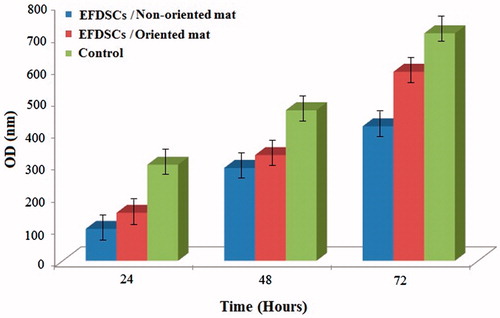
Figure 6. Immunocytochemistry of KRT3, KRT12, Connexin 43, DAPI and negative control (NC) for eyelid fat derived stem cells (EFDSCs) after culture on the (A) non-oriented nanofibrous gelatin mat, (B) oriented nanofibrous gelatin mat, and (C) control (TCPS).
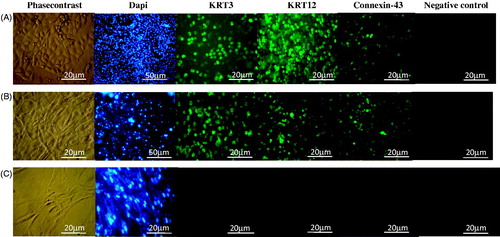
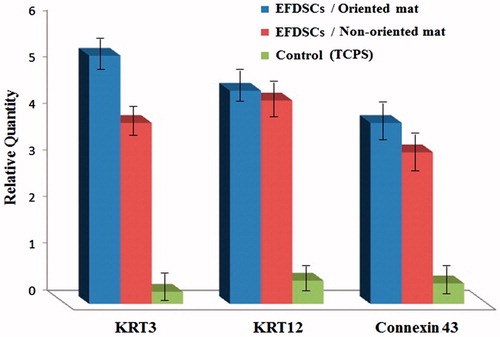
Figure 7. Expression level of KRT3, KRT12, Connexin 43, negative control (NC) for eyelid fat derived stem cells (EFDSCs) after culture on the (A) non-oriented nanofibrous gelatin mat, (B) oriented nanofibrous gelatin mat, and (C) control (TCPS) after 15 d induction by air lifting method (P < 0.001).