Figures & data
Table 1. cDNA synthesis reaction mixture.
Table 2. Primers used for relative quantification PCR.
Table 3. miRNA cDNA synthesis reaction mixture.
Table 4. miRNA qPCR reaction mixture.
Table 5. cDNA synthesis temperature profile.
Table 6. Primers’ sequences of qPCR.
Figure 1. CD133 + stem cells isolation. (a) Cord blood-derived CD133 + stem cells in day 2 of differentiation. (b) Flowcytometry analysis of isolated CD133 + indicates 97% purity on the day of isolation.
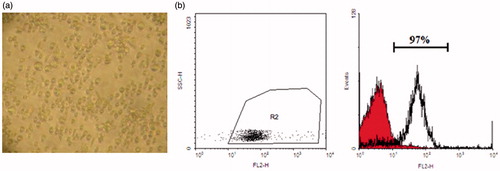
Figure 2. Electrophoresis of extracted RNA on day 0 and 14 of differentiation. 18S rRNA band (800 bp) and 28S rRNA band (1500 bp) of control and test samples on days 0 and 14 of differentiation are shown in the picture (a). RNA Integrity Number (RIN) in test (HSC-SB) (b) and control (HSC-C) (c) samples. (1) Pre-region marker; (2) 5s region; (3) fast region; (4) 18s fragment; (5) inter region; (6) 28s fragment; (7) precursor region; (8) post-region.
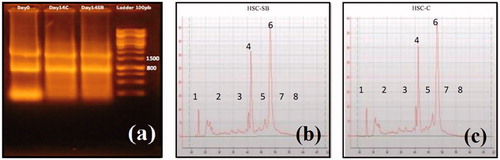
Figure 3. Relative expression of CD71, CD235a and Gamma globin in differentiated cells in comparison with control cells on days 0 and 14. Relative expression of CD71, CD235a, and Gamma globin significantly elevated in differentiated cells in comparison with control cells. Errors bars represent standard deviation. *P = 0.001 and **P = 0.0001.
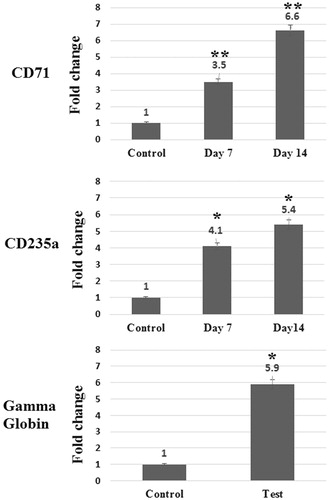
Figure 4. Quality control of the miRNAs. (a) The probes which attached to each sample. The probes show acceptable signals and weak signals (Flag A) were omitted; (b) Concentration graphs and probes distribution after normalization. Concentration graphs show normalized values and others indicate biases and statistical errors; (c) Distribution graphs and comparison between samples by Pearson product-moment correlation coefficient (Range: −1 ≤ r ≤ 1). This graph shows normalized values. X axis indicates control sample (HSC-C) and Y axis indicates test sample (HSC-SB).
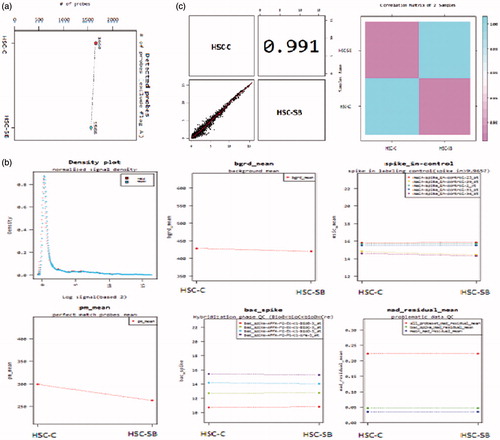
Table 7. Altered microRNAs and their related chromosome, sequence lengths, and sequences.
Figure 5. Microarray assay. (a) The graph of miRNAs expression in test (T, red, right column) and control (C, blue, left column) groups; (b) the graph of significant changes in miRNAs expression. 289 miRNAs down-regulated or up-regulated by |fc| ≥ 1.5 and 76 miRNAs down-regulated or up-regulated by |fc| ≥ 2 (upper column upregulated, lower column downregulated); (c) the graph of expression values distribution. X axis: Control and Y axis: Test; (d) the graph of the log changes. Volume = Squared root (normalized value of Control * normalized value of Test) Red dot (marked dots): top five ranking miRNAs in volume with significant cut-off. 180 × 147 mm (300 × 300 DPI).
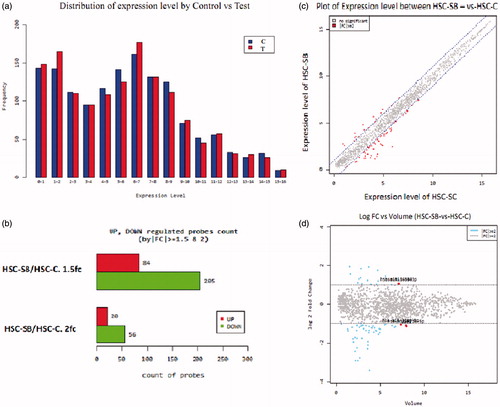
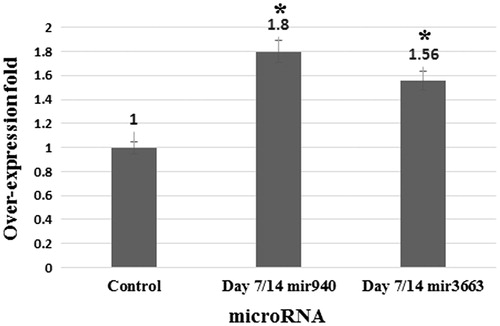
Figure 6. qPCR results by fold. Errors bars represent standard deviation. *P = 0.001.