Figures & data
Figure 1. Conversion of amino group of DCLHb to thiol group with 2-IT.
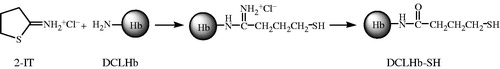
Figure 2. Structure of 1,6-BMH.
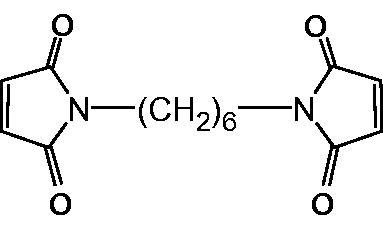
Figure 3. SDS-PAGE. (A–D) represent the elution of MW standards, purified Hb, DCLHb, and DCLHb-SH, respectively. E and F are polyDCLHb (cross-linked by 1,6-BMH).
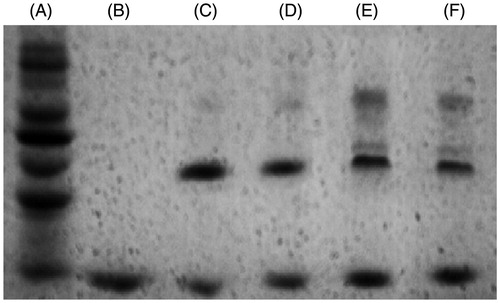
Figure 4. UV-Vis wavelength scanning of Hb, DCLHb-SH, and polyDCLHb.
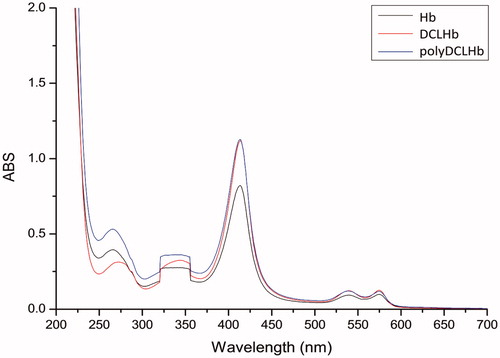
Figure 5. SEC-MALLS of polyDCLHb (ratio of 2-IT to Hb).
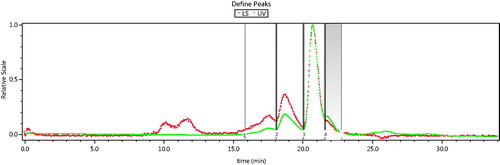
Table 1. MW distribution of polyDCLHb by SEC-MALLS.
Figure 6. HPLC of the products. (a) purified Hb, (b) DCLHb, and (c) polyDCLHb mobile phase 1 mol/L MgCl2.
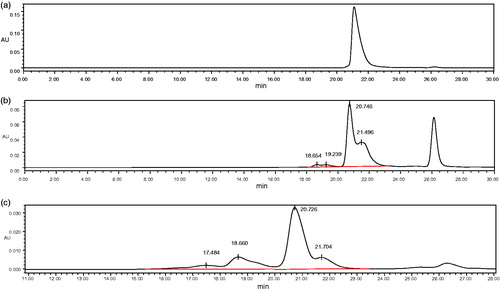
Table 2. The constituents and corresponding proportion of the chemical modified Hb.
Table 3. The proportion of polyDCLHb in the polymerization of DCLHb with 1,6-BMH with varial quantity of bromoacetic acid and 2-IT.
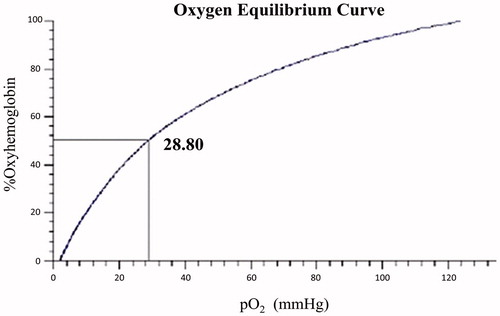
Figure 7. Oxygen binding curve of native hemoglobin was measured using a Hemox analyzer at 37 °C in PBS, pH 7.4. Vertical axis is the fraction of hemoglobin sites to which oxygen is bound. The partial oxygen pressure at 50% saturation is expressed in mmHg.
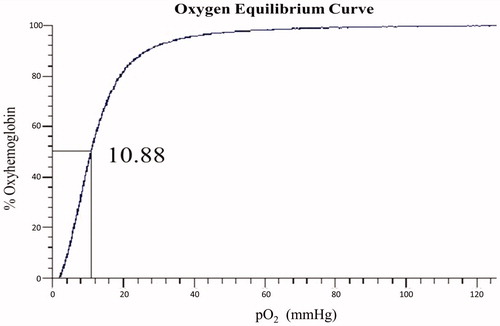
Figure 8. Oxygen binding curve of polyDCLHb was measured using a Hemox analyzer at 37 °C in PBS, pH 7.4 (2-IT 2 mmol/L, cross-linking agent 1 mmol/L).