Figures & data
Figure 1. A1: Sample with its native MetHb; A2: potassium cyanide (KCN) converts MetHb present in the sample to CnMetHb; A3: potassium ferricyanide (K3FeCN6) converts Hb present in the sample into MetHb which is converted into stable CnMetHb by KCN; A4: A1 to A4 is read at 630 nm for the MetHb; A5: Tube 4 is read at 540 nm. The difference between Tube A1 and A2 corresponds to the native MetHb from the sample; the difference between Tube A3 and A4 corresponds to the MetHb that could be present in the sample produced by all forms of Hb.
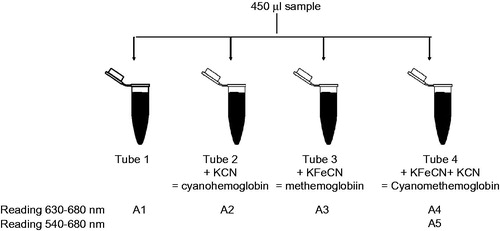
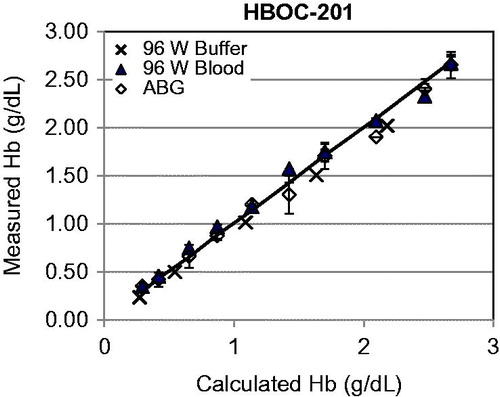
Figure 2. Measured vs. calculated Hb from HBOC-201 samples using the ABL or 96-well-plate method. X = 96-well-plate (W) with samples diluted in buffer, ▴ 96-well-plate (W) with samples diluted in blood, and ⋄ ABL with samples diluted in buffer. Mean ± SD.