Figures & data
Table 1. The primers sequence of GAPDH, BCL2 and BAX genes.
Figure 1. Flow cytometry analysis for the detection of Stra8 marker in testis isolated cells. Of testicular cells, 46.84% expressed Stra8 marker.
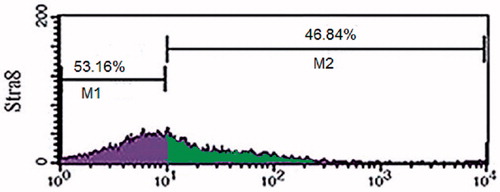
Figure 2. MTT analysis for assessment of viability in different treatment groups. Data show means ± SD; ****P≤0.0001.
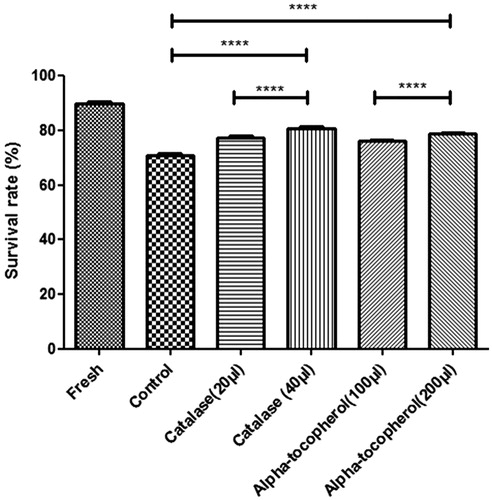
Figure 3. (A) BCL2, BAX and GAPDH1 RT-PCR. (1)100 bp DNA ladder, (2) negative control of RT-PCR (H2o), (3) control, (4) α-tocopherol and (5) catalase. (B) Expression pattern of apoptotic (Bax) and antiapoptotic (Bcl2) genes after cryopreservation analyzed by real-time PCR. Levels of Bax and Bcl2 were significantly decreased and increased respectively after adding 40 μl/ml catalase to the basic freezing medium. Data show mean ± SD; ****P≤ 0.0001.
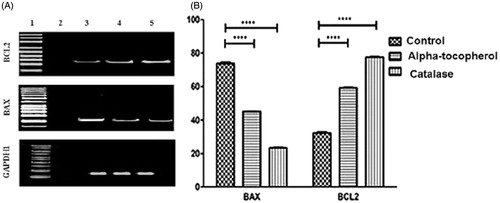
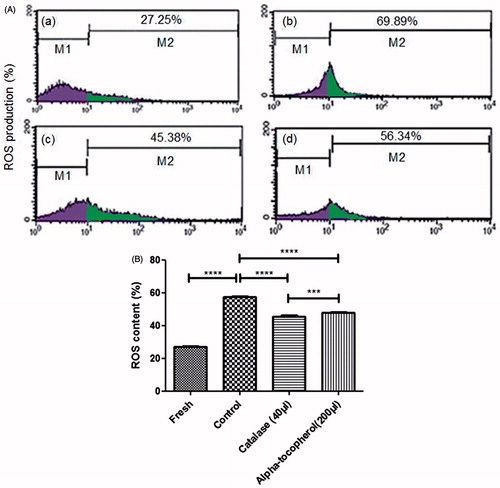
Figure 4. (A) Flow cytometry analysis for the detection of ROS in different treatment groups. a group (fresh), b group (control), c group (catalase 40 μl/ml)), d group (α-tocopherol 200 μl/m. M1: without DCF-DA, M2: with DCF-DA. (B) ROS production of SSCs before and after cryopreservation analyzed by flow cytometry. Note that the significant lower production of ROS after cryopreservation in 40 μl/ml catalase compared to control. Data show mean ± SD; ****P≤0.0001.