
Figures & data
Figure 1. The structure of VIN.
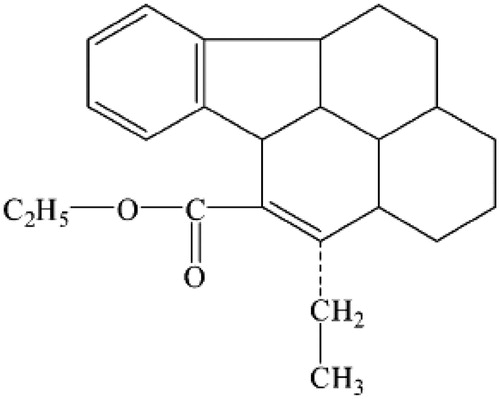
Figure 2. 50 000 × magnified TEM of normally prepared VIN-mPEG–PLA NPs.
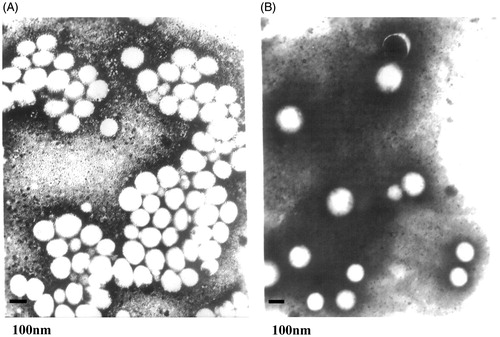
Figure 3. Mean particle size of prepared VIN mPEG–PLA NPs.
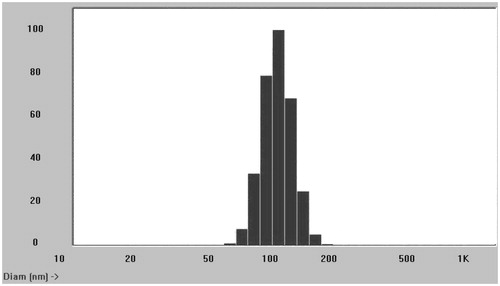
Table 1. Stability data of VIN mPEG–PLA NPs during 6 months.
Figure 4. In vitro release profiles of VIN mPEG–PLA NPs from three batches. Release experiments were carried out in PBS (pH 7.4), at 37 ± 0.5 °C. Each point represents the mean value of three different experiments ± SD. ⋄: VIN injection; △: VIN mPEG–PLA NPs.
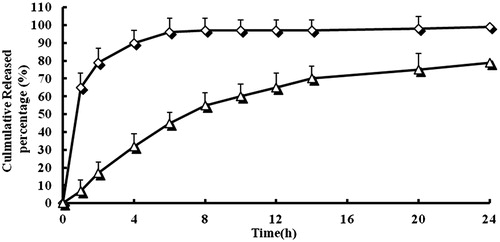
Figure 5. Mean plasma concentration (in value)–time profiles of VIN mPEG–PLA NPs and VIN injections. Each point represents the mean value of six SD rats. ⋄: VIN injection; △: VIN mPEG–PLA NPs.
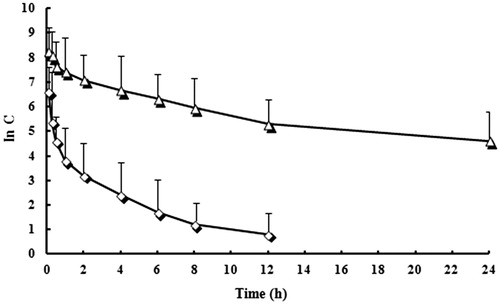
Table 2. Pharmacokinetic parameters of VIN mPEG–PLA NPs and VIN injections (n=6).