Figures & data
Table 1. Primer sequences used for real-time PCR.
Figure 1. SEM images of electrospun fibers of GEL/CS: (A) 30/70, (B) 40/60, (C) 50/50, (D) 60/40, and (E) 70/30(wt./wt.).
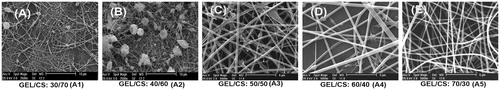
Figure 2. (A) X-ray diffraction of BGNPs. (B) FTIR spectra showed the presence of chemical band groups related to GEL/CS/BGNPs nanofibrous scaffolds. (C) SEM images revealing the topography of B1, B2, and B3 nanofibrous scaffolds. EDX analysis showing atomic composition of BGNPs ions (Ca, P, Si, and Mg) peaks were incorporated into GEL/CS nanofibrous scaffolds. (D) The average diameter of fibers with different contents of BGNPs in GEL/CS/ BGNPs nanofibrous scaffolds. Error bars show the mean ± SD.
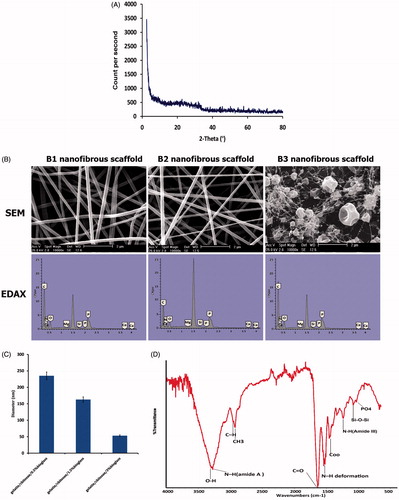
Figure 3. Flow cytometric analysis of the isolated hEnSCs for mesenchymal stem cell markers (CD105, CD29, and CD73), hematopoietic markers (CD34 and CD45) and endothelial marker(CD31). As shown, the isolated cells are positive for CD105, CD29, and 73 and are negative for CD34, CD45, and CD31.
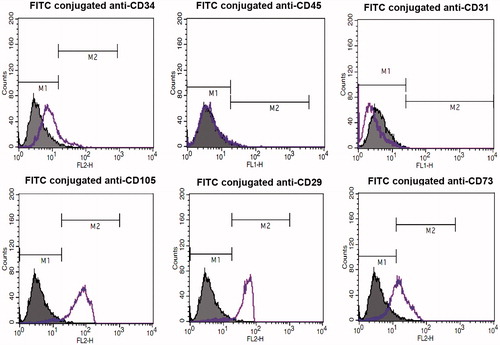
Figure 4. SEM micrographs and DAPI staining of hEnSCs after 3 days of cell culture on GEL/CS (A and B) and GEL/CS/BGNPs nanofibrous scaffolds (C and D). (E) MTT assay of hEnSCs was seeded on GEL/CS and GEL/CS/BGNPs scaffolds and TCP after 1, 3, and 5 days. Data are presented as mean ± SD of three independent experiments (*P <0.05; **P < 0.01, ***P < 0.001), (n = 3).
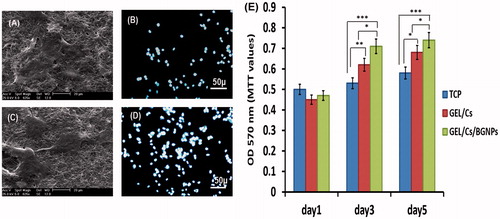
Figure 5. Morphological characterization of endothelial-like cells induced from hEnSCs. Phase-contrast images of hEnSCs before and after the treatment in TCP group. During the inductions, the morphology of cells changed from a spindle cell shape to a polygonal-shaped endothelial cell on day 17.
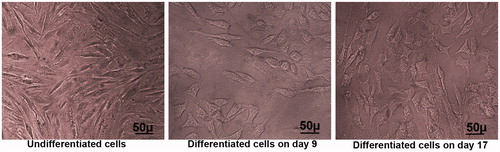
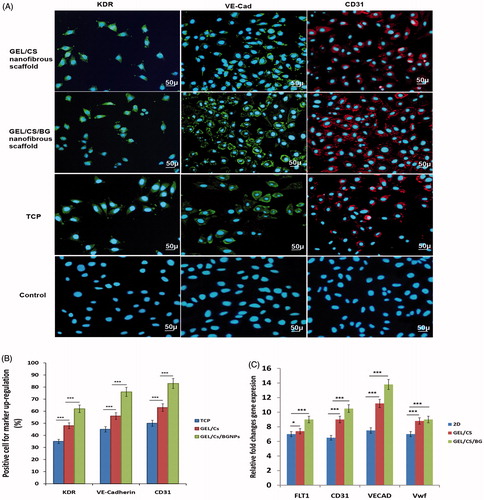
Figure 6. (A) Immunocytochemical images of cells stained with KDR, VE-Cadherin, and CD31 antibodies on 17th day post-treatment in TCP, GEL/CS, and GEL/CS/BGNPs scaffolds. Immunocytochemical analysis indicated that differentiated hEnSCs were positive for KDR, VE-Cadherin, and CD31 after 17 days post-treatments (scale bar, 50 μm). (B) Percentages of cells expressing biomarkers KDR, VE-Cadherin, and CD31 compared with TC P, GEL/CS, GEL/CS/BGNPs nanofibrous scaffolds. (P < 0.001, n = 3, mean ± SD). (C) Real-time PCR of endothelial-like cell markers in differentiated hEnSCs. Differentiated cells were evaluated for RNA expression of endothelial biomarkers 17 days post induction. Results revealed that differentiated cells could highly express FLT1, CD31, VECAD, and VwF. Expression of these biomarkers is higher in differentiated cells treated with BGNP compared with GEL/CS and TCP. These data indicated positive role of BG and 3D culture in endothelial stimulation. GAPDH is the housekeeping gene control (***P < 0.001; *P < 0.05). Error bars show the mean ± SD (n = 3).