
Figures & data
Figure 1. Chemical structure of bilirubin.
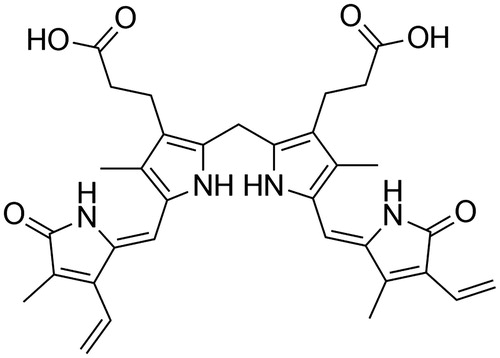
Figure 2. Pore size distribution of adsorbents.
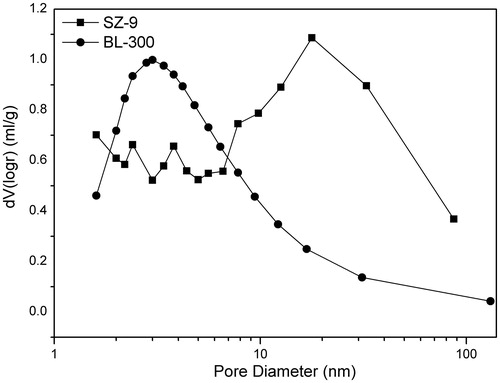
Table 1. Physical properties of adsorbents.
Figure 3. SEM micrographs of adsorbents (A, B: SZ-9; C, D: BL-300).
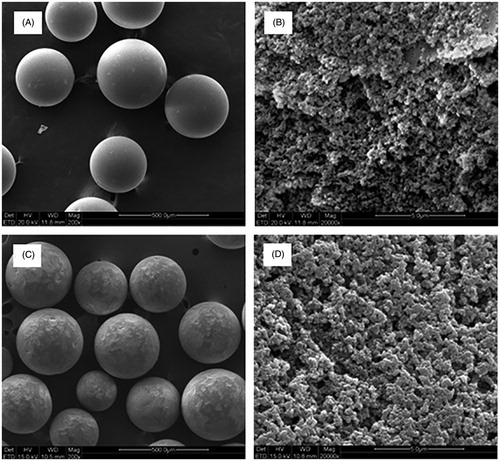
Figure 4. Adsorption kinetics of absorbents. (a) Bilirubin adsorption in BSA solution: CBIL = 150 mg/L, CBSA = 15 g/L, T = 37 °C; the adsorbent to solution ratio was 1:36 (v/v). (b) Bilirubin adsorption in phosphate buffer solution: CBIL = 150 mg/L, T = 37 °C; the adsorbent to solution ratio was 1:210 (v/v). (c) Bile acid adsorption in phosphate buffer solution: CBA = 150 mg/L, T = 37 °C; the adsorbent to solution ratio was 1:75 (v/v).
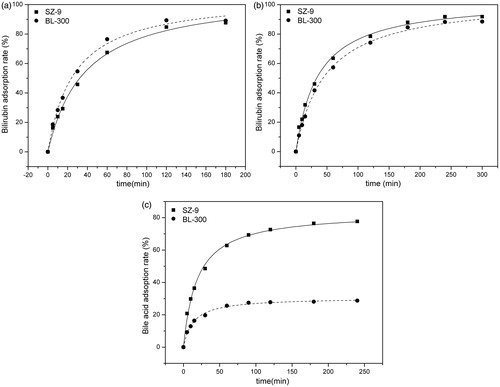
Figure 5. Effect of microenvironment on adsorption of bilirubin. The adsorbent to solution ratio was 1:36 (v/v). (a) Effect of temperature CBIL = 150 mg/L, CBSA = 15 g/L, t = 2 h. (b) Effect of ionic strength in solution. CBIL = 150 mg/L, CBSA = 15 g/L, T = 37 °C, t = 2 h. (c) Effect of albumin in adsorption medium. CBIL = 150 mg/L, T = 37 °C, t = 2 h.
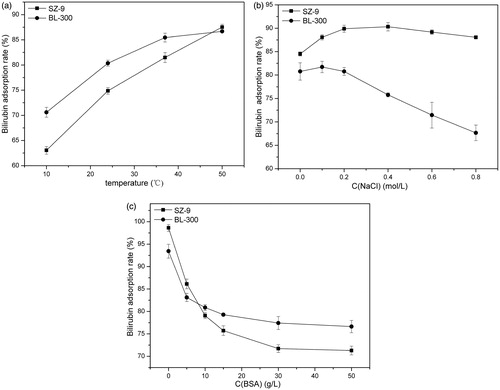
Figure 6. Adsorption isotherm of adsorbents. Temperature: 37 °C, a1–c1: fitting data with the Langmuir isotherm, a2–c2: fitting data with the Freundlich isotherm. (a) Adsorption isotherm of adsorbents for bilirubin in phosphate buffer solution. (b) Adsorption isotherm of adsorbents for bilirubin in BSA solution. (c) Adsorption isotherm of adsorbents for bile acid in phosphate buffer solution.
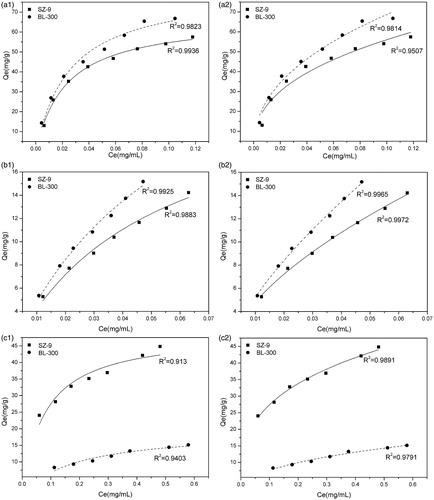
Figure 7. Effect of different concentrations of plasma from patients on adsorption. T = 37 °C, t = 3 h. The adsorbent to plasma ratio was 1:5 (v/v). (a) Initial plasma (L): CTBIL = 25.3 μmol/L, CDBIL = 5.3 μmol/L, CIBIL = 20 μmol/L, CTBA = 25.4 μmol/L. (b) Initial plasma (M): CTBIL = 178.1 μmol/L, CDBIL = 69.1 μmol/L, CIBIL = 109 μmol/L, CTBA = 130.7 μmol/L. (c) Initial plasma (H): CTBIL = 258 μmol/L, CDBIL = 93.1 μmol/L, CIBIL = 164.9 μmol/L, CTBA = 62.6 μmol/L.
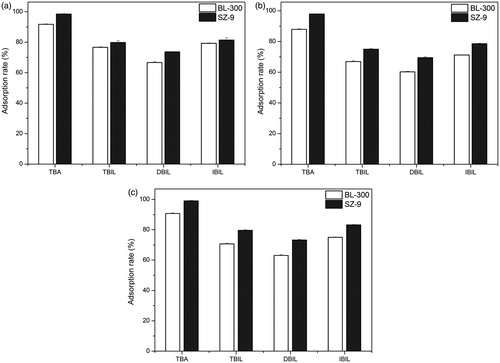
Figure 8. Dynamic adsorption in vitro. T = 37 °C; the adsorbent to solution ratio was 1:12.5 (v/v). Initial plasma: CTBIL = 180.8 μmol/L, CDBIL = 71.6 μmol/L, CIBIL = 109.2 μmol/L, CTBA = 117.6 μmol/L.
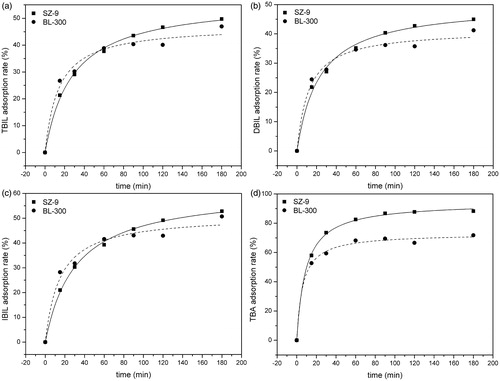
Table 2. Blood chemistry of plasma before and after dynamic adsorption in vitro.
Table 3. Blood routine and hemolysis assay after 60 min contact with adsorbents.