Figures & data
Table 1. Factorial design study showing the effect of process variables on particle size and drug content.
Figure 1. (a) Main effect plot showing the effect of individual process variables on the mean particle size. (b) An interaction plot showing the effect of process variables on the mean particle size.
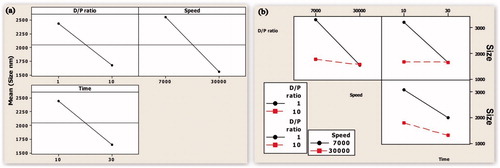
Figure 2. (a) Contour plot showing the effect of lower drug–polymer ratio on mean particle size. (b) Contour plot showing the effect of higher drug–polymer ratio on mean particle size.
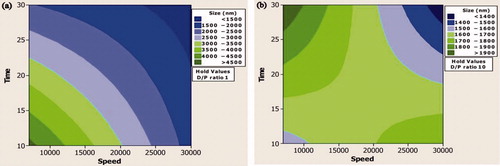
Table 2. The effect of process variables on size, zeta potential and drug content.
Figure 3. (a) Main effect plot showing the effect of individual process variables on drug content. (b) An interaction plot showing the effect of process variables on drug content.
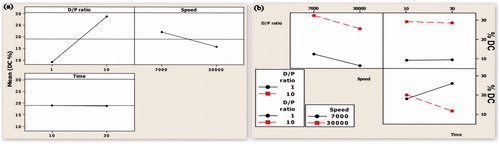
Figure 4. Contour plot showing the effect of interaction of homogenization speed and time on size, polydispersity index, zeta potential, and drug content.
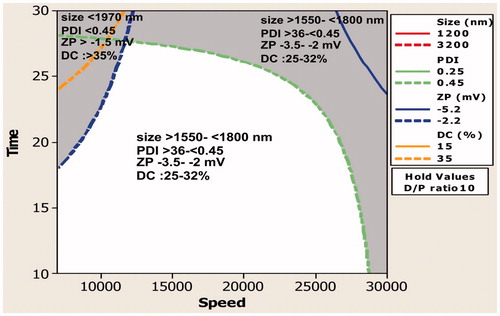
Figure 5. SEM images of PLGA–curcumin microparticle-embedded chitosan scaffold. (a) Cross-section view of PLGA–curcumin microparticle-embedded chitosan scaffold showing clear interconnected pores. (b) Cross-section view of the scaffold (at 1.00 K × magnification) showing the layers. (c) Cross-section view of the scaffold (at 2.00 K × magnification) showing the microparticles in the scaffold layer. d) Cross-section view of the scaffold in another location (at 1.00 K × magnification) showing the layers. (e) Cross-section view of the scaffold (at 10.0 K × magnification) showing the microparticles in the scaffold layer. (f) Individual PLGA–curcumin microparticle-embedded in the chitosan scaffold layer (at 10.0 K × magnification).
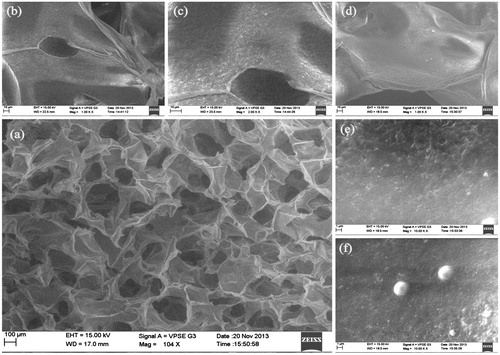
Figure 6. Cumulative drug release (data are expressed as standard error of mean).
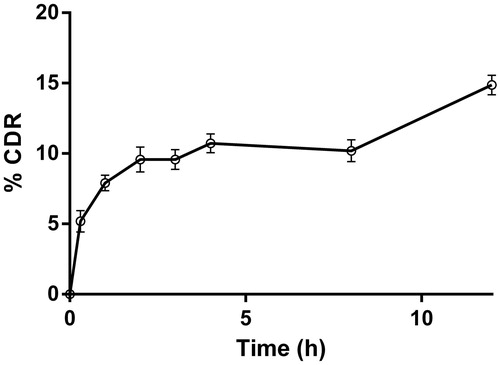
Figure 7. Antibacterial activity of PLGA–curcumin microparticle-embedded chitosan scaffold by modified broth dilution method. Values are expressed as SEM of three trials.
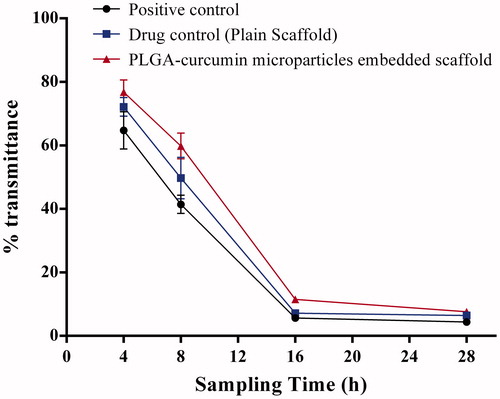
Figure 8. Wound contraction rate of PLGA–curcumin microparticles at different time intervals and skin epithelialization period (EP) in SD rats. Values are expressed as mean ± SEM.
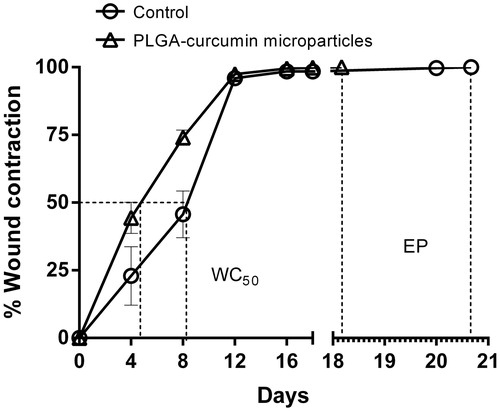
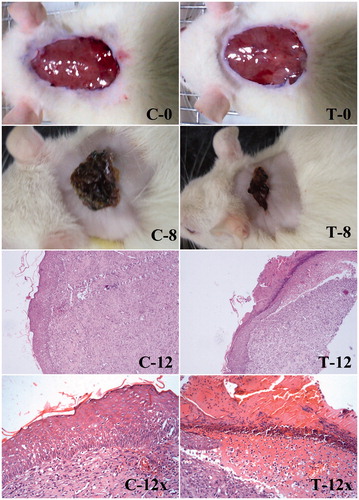
Figure 9. Wound healing and histological evaluation of PLGA–curcumin microparticles in SD rats. (C-0) Control – initial day wound (C-8) Control – 8th day wound (C-12) Control – 12th day wound (at 10× magnification) (C-12x) Control – 12th day wound (at 40× magnification). (T-0) PLGA–curcumin microparticles treated – initial day wound (T-8) PLGA–curcumin microparticles treated – 8th day wound (T-12) PLGA–curcumin microparticles treated - 12th day wound (at 10× magnification) (T-12×) PLGA–curcumin microparticles treated - 12th day wound (at 40× magnification).